Thursday, June 30, 2022

LA Dodgers Win NL Statis-Pro Title with 19 Runs in 3 Games

 The LA Dodgers fielding and bullpen are not strong in this year's 2022 Projected Statis-Pro Cards, but when a team can average more than 6 runs a game even against the best pitching team in the NL it's enough for a title.

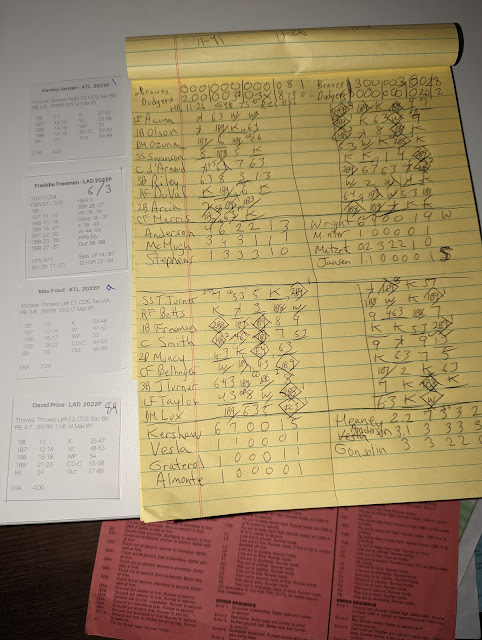
We wrote in the standings on the decisive Game 3 Scoresheet below. Every batter in both line-ups had between 1 and 3 hits during the 3-game series, except for the Dodgers two leadoff batters Trea Turner (5 for 13, 2 steals and a homer) and Mookie Betts (4 for 13, 2 doubles). There cards are pictured by the scoresheet.

While they won with their bats, the pitching star was Urias, who pitched a lights out gem in Game 1 with 7 innings, 3 hits allowed, 10 strikeouts and 1 walk. The only run allowed was very unearned. Urias bobbled a grounder by the Brewers player by the same name (Urias), and later catch Will Smith allowed a passed ball for him to score the only Brewers run in what would be an 8-1 Dodgers win.

Just like in the semifinals, the Dodgers lost Game 2 to allow the Brewers to have their ace on the mound for the deciding Game 3. 

However, Turner walked and stole second and Betts singled to start the first inning and later both scored against Burns to make it 2-0. With the Brewers bullpen stretched in the Game 2 win, even a tired PB2-7 Burnes (down from PB2-9) was the best option to start the 7th with a 2-2 tied game and try to get to the best reliever in the game, Hader, but Turner blasted a 2-run homer to make it 4-2. In the 8th, they likewise got to a tiring Hader as Bellinger doubled, Taylor doubled him home, Turner singled him home and then Betts hit a deep sac fly that just missed a home run (DEEP drive of 27 held in by the Dodgers ballpark range of 11-26 for home runs.

The Brewers did rally for two in the 9th to cut it to 7-5, and had runners on 1st and 3rd. Renfroe came to the plate as the winning run - having homered the previous at bat, but he lined out to the Dodgers last reliever Vesla to wrap up the Dodgers title.

We are actually playing the AL season this year, but our NL commissioner has a crazy busy work year and wanted to at least get an NL tournament in to see the teams. The playoff bracket is listed below and now we will return to the AL season.

All 2022 Projected Batters (49 pages, 9 cards to a page) and All 2022 Projected Pitchers (62 pages, 9 cards to a page) are needed to play the Statis-Pro baseball Game, but we did catch one adjustment to the PB rating of pitchers based on the team on which they played. You can either use this link which has the correct numbers for all the pitcher cards or print out the cards from the link above and then adjust all the pitchers on certain teams by referencing this blog.


Wednesday, June 29, 2022

Will Smith Grand Slam Off Jansen Sends Dodgers to Title Series

A wild back-and-forth Game 3 deciding game included a 53 minute rain delay dropped Price's PB to 2-6 and Fried's to 2-7, included the Dodgers batting around twice and the Braves sending 10 men to the plate once.

The Dodgers started the game at a huge disadvantage with Walker Buhler's PB 2-8 card not used because he was on 60-day DL. The seemed at an even bigger disadvantage trailing 9-7 after 6 innings with.Dodgers PB 2-7s Graterol and Kimbrel going up against the Braves trio of PB 2-8 relievers Minter, Matzek and former Dodger Jansen.

The trio retired the first 5 in a row but then Trea Turner singled and Matzek walked Muncy and Taylor to bring Will Smith to the plate with bases loaded. His former battery mate Jansen was forced.to come in to get the last out of the 8th, but Smith hit a grandslam homer to give the Dodgers their final 11-9 margin.

The Dodgers win the 3-game series in our NL Statis-Pro tournament and will now face the Brewers in a 3-game series for the title.


Sunday, June 26, 2022

Dodgers, Braves Crush Each Other to Force Game 3

 Freddie Freeman had hits his first three at bats against his old teammates to back 6 shutout innings by Clayton Kershaw in a Dodgers 8-0 blow out of the Braves that happened to coincide with the Dodgers beating the Braves on TV.

Jansen then turned the tables with a 4-out save against his old Dodgers team, which could be a disaster for the Dodgers since we had to take the card of would-be Game 3 Starter Walker Buhler die to him landing on 60-day DL, which means David Price (PB 4-7, average) against Braves ace Max Fried.

The Braves as actually dominated starting with the first three batters, as Acuna was hit by a pitch, Olson doubled him home and Ozuna homered to make it 3-0. It was 6-0 heading into the 8th but Metzek allowed 2 runs and runners on 2nd and 3rd to force Jansen in for a 4-out save. It was a save situation because at 6-2 with 2 runners in, the tying run was on deck.

Jansen retired all four Dodgers, which was key, because our league rules are that if a reliever pitches to at least 5 batters (or in 2 straight games) then he must sit out the next game. Jansen will be available for game 3 to see who plays Milwaukee.

All 2022 Projected Batters (49 pages, 9 cards to a page) and All 2022 Projected Pitchers (62 pages, 9 cards to a page) is the only other thing needed to play the game, though more detailed instructions appear in this Statis-Pro baseball Game Rules.


Click for the free Statis-Pro Master Baseball Game. Click here for 60 of the all-time great MLB teams, or on teams of many of the all-time great players on teams by nation or state with one sheet for each team. Or click on the 2023 pitchers and 2023 batters in card form. You simply print two teams cards and then either print the master link above and fast action cards in master link or buy the dice to start playing.

Braves vs. Dodgers Statis-Pro Semifinal - Reminder on adding cards for missing players

As we set up NL Statis-Pro semifinal, we saw some players were added to the roster since the Braves and Dodgers last played in our game a month ago. If you do not see a player you need to add, you go to this link for pitchers, and this link for batters to find the numbers to put on the card. If you can't find a batter on that sheet, you can look at the all batters sheet (including those who started the year inactive). This is only if you do NOT see the player on the main projected cards produced for the season on the links on the paragraph below.

All 2022 Projected Batters (49 pages, 9 cards to a page) and All 2022 Projected Pitchers (62 pages, 9 cards to a page) is the only other thing needed to play the game, though more detailed instructions appear in this Statis-Pro baseball Game Rules.

We also take players off the Statis-Pro team if they are on 60-day DL. For the Dodgers they lost only one player - but it was a huge one in Walker Buhler due to his surgery for bone spurs. The only additional pitchers they picked up were Tyler Anderson (a below average PB 2-6) and a PB 2-5 Yency Almonte.

While the printed cards look nice, I just write out the missing cards based on the extra card sheets as shown below.


The Braves had the most roster changes we had to update from when we played them earlier. Four players we were able to add were Ronald Acuna (no longer on 60-day DL though he actually has a new injurty), Michael Harris II, and pitchers who had cards but did not have them with the stack I used for the Mets series - Jackson Stephens and Will Smith. 


The Braves did however lose four players.


With those in place, we set out to play the best-of-3 to determine who would face the Brewers for our NL title.


4 of 5 top NL teams in Statis-Pro NL semifinals

As we prep for our second Statis-Pro NL semifinal, we pulled up the standings and noted our four finalists are currently in the Top 5 in the actual MLB standings.


Saturday, June 25, 2022

Brewers' relievers and late inning HRs Advance to play Braves-LA Winner for Title

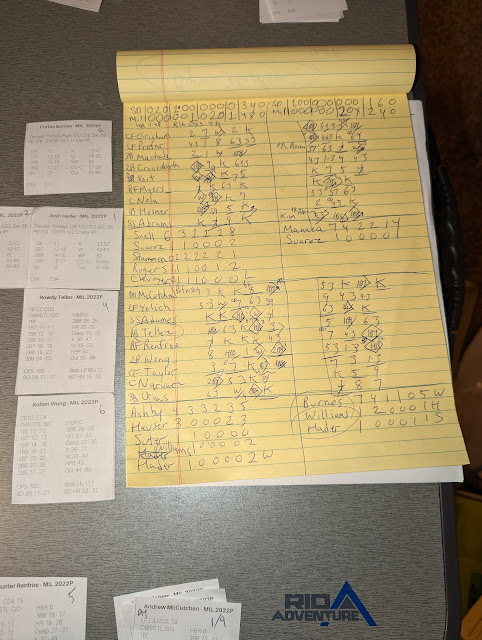
 The Brewers used late 2-run homers to rally from behind twice against the Padres. The consecutive 1-run wins advance the Brewers to face the Dodgers-Braves winner for the NL Statis-Pro baseball game title.

Blake Snell was brilliant for the Padres in Game 1, yielding only a 6th inning solo shot from Adames to leave with a 3-1 lead.

However the bullpen could not hold it as Rowdy Tellez hit a 2-run homer on a DEEP drive in the 8th and Kolten Wong had the game winning double in the 10th for the 4-3 win. The Brewers hit 2 other DEEP drives earlier in the game - which in Milwaukee are a Homer on 11-48 or sac fly out on a 51-88, but both were caught against the wall on a "51" and "57." However, Tellez drive was a "17" for a no doubter, and Adames was an HR on his card.

Sean Manaea was even better for the Padres with 6 scoreless innings, but in the 7th it was Wong with the game-winner again, a 2-run holer for the 2-1 win in Game 2 for the sweep of the best-of-3. Burns allowed a double and rbi-single to start the game behind 1-0, but finished 7 innings without allowing any other runs.

It was an almost unheard of game in which the Padres faces a PB 2-9 pitcher (best control, keeps on pitcher's card 83% of the time) for all 9 innings. In addition to Burnes being a PB 2-9, ace relievers Williams and the best pitching card in the game Hader are PB 2-9 and pitched scoreless innings in both games.


Brewers Urias Card and Padres Clevinger Card Added for Clash

The reason we like to play the current Statis-Pro seasons is to keep up with major moves and get a feel for how good players,. line-ups and rotation for together.

In setting up for our NL semifinal tournament we noted two players for whom we had not had cards were the Padres Mike Clevinger, listed as the No. 5 starter, and the Brewers Luis Urias, listed as the starting 2nd baseman.

We went back to the 2021 projected cards and will use them, except we lower the PB by on level (a 4-7 for Clevinger) and change the top homer number to a DEEP (Urias is an HR 27 and Deep is 28-32).


Back to Statis-Pro Baseball, NL Semifinals Renew

We plan our first Statis-Pro baseball games of June after the NL tournament semifinals were set at the end of May with the Braves vs. Dodgers and Padres vs. Brewers. We had to double check for roster changes, but it was a super hectic month of campaign work for my job and we decided to use the few hours available to finish up a couple of the Value Add Basketball Game series around the NBA Finals and NBA Draft.

Now back to baseball, we are actually playing the AL this season, but fit in a 10-team NL tournament to see the cards on their rosters. Here are the screen shots of how the 4 semifinalists won their last round.

Brewers survived the Phillies 2 games to 1.


LA Dodgers Swept the Cardinals


Padres pitching dominated the Giants


The Braves battled past the Mets with deGrom out for 60-day DL.


Thursday, June 23, 2022

"Are you Grayson?" Chance Meeting with With Best Value Add 2018

 At baggage claim in an airport today, the day of the NBA Draft coincidentally, I looked up and saw a familiar face. Not wanting to invade personal space, I waited, but luckily he saw his bag passing by, came over to scoop it up - giving me the chance to say, "Are you Grayson?"

A little surprised he gave a big smile and answered politely that it was in fact Grayson Allen.

I told him I was just a big college basketball fan with two brothers who went to Duke, and ran a fun site www.valueaddbasketball.com that ranks college basketball players and that it calculated he was one of the best ever. 

And so it is, Value Add goes by the numbers not whether or not fans like a player or not, and here is his history.

Grayson was credited for being the spark off the bench as a freshman to win the 2015 title, and clearly a sharp kid as he was named All-Academic, All-American.

His sophomore year he was named 2nd team All-American as one of the 10 best players of 4,000 in the country by The Sporting News, and Value Add agreed calculating him as the 10th most valuable in the country. 

Junior year was down, but Senior season he finished as the most valuable player per game in the country - but let me explain after viewing his year by year:


You see his No. 10 ranking in 2016, and even the 208th ranking is top 5% of all players and freshman 792nd is top 20%. But focus on the 38th place ranking, already top 1% of all players, but in fact the notes show he only played in 26 of 37 games that year. Since players get a 0 for any game they can't play, you use this simple formula - team games ÷ players games played x value add ranking = value add per game.


Running the formula you see Grayson actually improved Duke 10.60 points per game, which actually made him the most valuable player in the country per game - edging out West Virginia's Jevon Carter and Villanova's Mikal Bridges as MVP.


Tuesday, June 21, 2022

Pierce's Kansas blows out Michigan State 85-61 for title

 Paul Pierce's Kansas teams finished 4th, 1st and 2nd in the final rankings, but none of the three made the Final 4. This 1997 was the most dominant, but was beaten by the eventual surprise champs from Arizona. 

However, the Jayhawks won our 4th Value Add Basketball Game tournament going away, with an 85-61 win against the Michigan State 2000 squad of Mateen Cleaves.

Ryan Robertson hit three 3-pointers in the closing minutes of the 1st half, the Pierce scored three times in the first four possessions of the second half and the Jayhawks pulled away, outscoring MSU 30-13 in the final 9 minutes for the 85-61 final.


Sunday, June 19, 2022

Pierce, 6'11 Twin Towers Pummel Duke

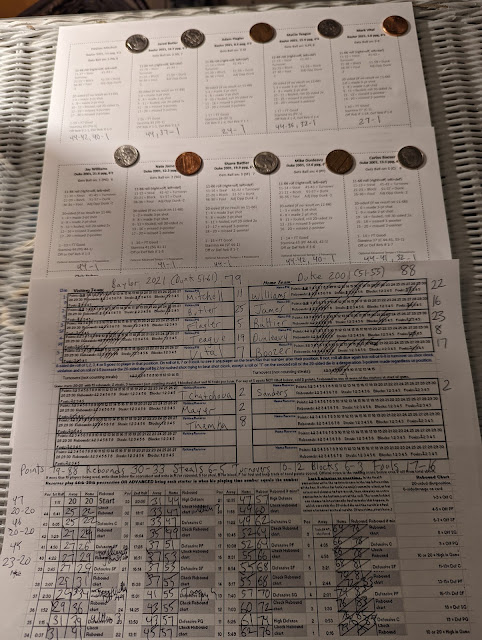
 In a battle between two of the top 6 rated teams of all time, Kansas Paul Pierce and the twin towers of 6-foot-11 Raef LaFrentz and Scot Pollard helped Kansas 1997 out rebound Duke 2001 on the boards 36-27.

The back court was just as dominant with both Jacque Vaughn and Jerod Haase had four of the teams 12 steals, and all five scored in double figures for a 77-66 win in our second semifinal.

Shane Battier responded with 26 points, and Jay Williams had 16 points and opened the game with one of his three steals, but it was not enough.

We had hoped the NBA could have a Game 7 today, so we could have our Final Four the same day, but Kansas 1997 will face Michigan State 2000 for our tournament title.

Both of these teams and Duke were left out of the original 96 the tournament because we only allowed each school to have one team per century in that batch, and we used Kansas Wilt Chamberlain team and Michigan State's Magic Johnson team from the 20th century. We probably should have used this Duke team in the original 96, but the 2001 season was a bit lost between the 20th century and the start of the www.kenpom.com era and we went with Jon Scheyer's team from 10 years later.


RESULT ADDED - DePaul 1980 Leads Most Surprising Team List going into Semi vs. Michigan State 2000

The stunning DePaul Blue Demons of 1980 now tip off in our latest Value Add Basketball Game Final 4. Based on the player cards in the game, we only ranked DePaul as the 108th of 135 great all-time teams, but when Terry Cummings drew a 5th foul on Kareem Abdul-Jabbar with 15 minutes to go in their game, DePaul went onto a huge come from behind upset and improved to the 18th ranked team in the game with a 3-0 mark.

They play Michigan State 2000, which on the most improved team list below comes in 20th, we pegged them based on their cards as a +4 (original ranking) and they have played four points better at a +7.8 ranking - however that is only the difference between being picked 22nd and moving up six spots to No. 16.

We will paste the results and scoresheets of this game once completed. The other semifinal games features two teams we expected to be there - 3rd ranked Duke 2001 and 6th ranked Kansas 1997. 

DePaul's Cinderella run ended at the hands of Michigan State's Morris Peterson (23 points) and Mateen Cleaves (2 of 5 steals in closing 4 minutes) - as the Spartans won 72-66 and now wait the winner of Duke vs. Kansas.


Original RnkRnkTeam Playing the highest above expectationOriginalCurrentImproveWinsLosses
10118DePaul - 1980 - Mark Aguirre-67.51430
141Kansas - 2008 - Mario Chalmers6161051
4920North Carolina - 1982 - Michael Jordan07751
7024Auburn - 2019 - Chuma Okeke-25781
11661UTEP (Texas Western) - 1966 - Bobby Joe Hill-7-0.5721
3112Virginia - 2019 - Kyle Guy39641
3615Baylor - 2021 - Jared Butler28621
3717Connecticut - 2004 - Ben Gordon27.6642
7135Michigan - 1965 - Cazzie Russell-23511
7238Loyola Marymount - 1990 - Bo Kimble-23511
219Houston - 1968 - Elvin Hayes49531
4322Purdue - 2018 - Carsen Edwards16541
5027Wake Forest - 1996 - Tim Duncan05521
7342Oklahoma - 1985 - Wayman Tisdale-22431
6037Iowa - 2021 - Luka Garza-13410
8349Michigan St. - 2009 - Draymond Green-31.3463
9155Colorado - 2021 - McKinley Wright-40410
7444Missouri - 1982 - Steve Stipanovich-22.2420
157Indiana - 1976 - Scott May610431
2216Michigan St. - 2000 - Mateen Cleaves47.8430
6140Syracuse - 2003 - Carmelo Anthony-12.8421
2319Louisville - 2013 - Russ Smith48421
10275Maryland - 1984 - Len Bias-6-3311
8457Syracuse - 1987 - Rony Seikaly-30321
1714Duke - 2010 - Jon Scheyer58352
85Villanova - 2018 - Mikal Bridges811372
5139Oregon - 2017 - Dillon Brooks03343
7550Georgetown - 1984 - Patrick Ewing-21321
9268Marquette - 1971 - Jim Chones-4-1.4311
96Kansas - 1997 - Paul Pierce811330
3825Houston - 1983 - Hakeem Olajuwon24.5321
3926Michigan St. - 1979 - Magic Johnson25321
7653USC - 2021 - Evan Mobley-21310
134129LSU - 1970 - Pete Maravich-15-13301
1210Gonzaga - 2017 - Nigel Williams-Goss79232
9577Kansas St. - 2008 - Michael Beasley-5-3211
9373Marquette - 2003 - Dwyane Wade-4-2222
108North Carolina - 2005 - Sean May810232
8565Dayton - 2020 - Obi Toppin-3-1210
9474Marquette - 1977 - Butch Lee-4-3111
53Duke - 2001 - Shane Battier1213120
3230Memphis - 2008 - Derrick Rose34142
10384DePaul - 1945 - George Mikan-6-5101
10485Holy Cross - 1950 - Bob Cousy-6-5111
128107South Carolina - 1973 - Mike Dunleavy-9-8101
6258Jacksonville - 1970 - Artis Gilmore-1-0.2111
10590Iowa - 2002 - Reggie Evans-6-5.2112
5252Seton Hall - 1989 - John Morton01111
135135Niagara - 1970 - Calvin Murphy-17-16.5101
2428Illinois - 2005 - Deron Williams44032
10693Tennessee - 1977 - Bernard King-6-6011
129119Georgia - 1982 - Dominique Wilkins-10-9.6011
5354Texas Tech - 2019 - Jarrett Culver00032
4448Indiana - 1981 - Isaiah Thomas11.4011
8676San Diego St. - 2011 - Kawhi Leonard-3-3022
1823NC State - 1974 - David Thompson55.1021
117103Davidson - 2008 - Stephen Curry-7-7015
2529Illinois - 1989 - Nick Anderson44010
118105Notre Dame - 1989 - Orlando Woodridge-7-7001
122108Notre Dame - 1970 - Austin Carr-8-8012
2632Kentucky - 2012 - Anthony Davis43.7042
10799Seattle - 1958 - Elgin Baylor-6-6.3001
123111Auburn - 1984 - Charles Barkley-8-8.4011
6369Georgetown - 2007 - Roy Hibbert-1-1.5-112
8779South Carolina - 2017 - Sindarius Thornwell-3-3.5-112
108101Wichita St. - 2013 - Fred VanVleet-6-7-112
5463Florida - 2006 - Joakim Noah0-1-153
2736Wisconsin - 2015 - Frank Kaminsky43-122
109102Alabama - 1977 - Reggie King-6-7-101
4556Michigan - 2013 - Trey Burke10-112
611Duke - 1992 - Christian Laettner109-111
7778St. John's - 1985 - Chris Mullin-2-3-101
9696California - 1959 - Jack Grout-5-6-101
110106Marquette - 2011 - Jimmy Butler-6-7-101
5566Georgia Tech - 2004 - Jarrett Jack0-1-123
124118Villanova - 1985 - Ed Pinckney-8-9.5-201
132130VCU - 2011 - Bradford Burgess-12-14-203
713Cincinnati - 1960 - Oscar Robertson108-211
2841Arizona - 2015 - Stanley Johnson42.4-231
4662Ohio St. - 2007 - Greg Oden1-1-223
22UCLA - 1972 - Bill Walton1715-260
5671Kansas - 1957 - Wilt Chamberlain0-2-211
119113West Virginia - 1959 - Jerry West-7-9-201
4764Pittsburgh - 2009 - DeJuan Blair1-1-213
120115Brigham Young - 1981 - Danny Ainge-7-9-201
125121George Mason - 2006 - Jai Lewis-8-10-203
7881Kentucky - 1948 - Alex Groza-2-4-211
3351Arizona - 1997 - Mike Bibby31-221
4867Purdue - 1969 - Rick Mount1-1.3-201
111109Indiana St. - 1979 - Larry Bird-6-8.3-201
2946Cincinnati - 2002 - Jason Maxiell42-222
1634Connecticut - 1999 - Richard Hamilton64-301
4060San Francisco - 1956 - Bill Russell2-1-301
8891UCLA - 2006 - Jordan Farmar-3-6-323
121117Navy - 1986 - David Robinson-7-9.5-301
126122Arizona St. - 1980 - Byron Scott-8-11-301
1943Arkansas - 1994 - Corliss Williamson52-301
112112La Salle - 1954 - Tom Gola-6-9-301
113114Wyoming - 1943 - Ken Sailors-6-9-301
1331Michigan - 1989 - Glen Rice74-301
6482Indiana - 2002 - Jared Jeffries-1-4-313
97110Kansas - 1988 - Danny Manning-5-8.3-301
114116North Carolina - 1957 - Lennie Rosenbluth-6-9-301
133134Miami FL - 1965 - Rick Berry-12-15-301
2047Ohio St. - 1960 - Jerry Lucas52-401
5780Oklahoma St. - 2004 - John Lucas0-3.6-413
4170Duke - 1986 - Johnny Dawkins2-2-401
7994Oklahoma St. - 1946 - Bob Kurland-2-6-401
8095Texas - 2003 - T.J. Ford-2-5.8-412
127127Dayton - 1967 - Don May-8-11.8-401
130131Princeton - 1965 - Bill Bradley-10-14-401
6583Oklahoma - 2016 - Buddy Hield-1-4.9-413
4272LSU - 1992 - Shaquille O'Neal2-2-401
89104LSU - 2006 - Glen Davis-3-7-412
6689West Virginia - 2010 - Kevin Jones-1-5-413
3059Loyola-Chicago - 1963 - Jerry Harkness40-401
81100Virginia - 1981 - Ralph Sampson-2-6-401
6792Utah - 1998 - Andre Miller-1-6-501
131133Loyola-Chicago - 2018 - Cameron Krutwig-10-15-503
5887St. Joe's - 2004 - Jameer Nelson0-5-512
6897St. Bonaventure - 1970 - Bob Lanier-1-6-501
6998Georgia Tech - 1990 - Dennis Scott-1-6.3-501
98123Arkansas - 1978 - Sidney Moncrief-5-10.8-601
1145North Carolina - 1998 - Vince Carter82-621
99126Creighton - 2020 - Ty-Shon Alexander-5-12-701
321UNLV - 1991 - Larry Johnson136-711
100128Louisville - 1980 - Darrell Griffith-5-12-701
14Kentucky - 1996 - Antoine Walker1811-701
90120Kentucky - 1970 - Dan Issel-3-10-701
3486Maryland - 2002 - Juan Dixon3-5-813
3588UNLV - 1987 - Armen Gilliam3-5-801
115132Butler - 2010 - Gordon Hayward-6-14.2-803
82125Creighton - 2014 - Doug McDermott-2-11-903
433UCLA - 1967 - Lew Alcindor134-911
59124Wake Forest - 2005 - Chris Paul0-10.8-1103

Saturday, June 18, 2022

MSU & DePaul shoot up in rankings; Other Final 4 Features Duke vs. Kansas

The Final 4 of our new tournament features on expected game and one surprise game.

In one semifinal Duke 2001 stayed at No. 3 in our all-time rankings, and now faces Kansas, who moved up one spot to No. 6. The only teams ahead of Duke are UCLA 1972 and Kansas 2008.

Kansas now has 2 of the top 6 ranked teams in our game, while Duke has 3 of the top 14 teams - so this truly will be the blue blood of all time.

The other semifinal is the two surprise teams, both of whom moved up 28 spots after two upset wins to make the Final Four. DePaul 1980 shot up all the way to No. 18 after Terry Cummings drew five fouls on Kareem Abdul-Jabbar, whose 1967 UCLA team dropped 29 spots to No. 33.

Michigan State 2000 is now No. 16, after easily defeating North Carolina 1998, which dropped to No. 45 in our all-time ratings.

As for the drops of the teams losing in the last 2 rounds, Houston dropped just 2 spots to No. 25 with their heartbreaking Elite 8 loss. Baylor dropped 7 spots to No. 15 after the loss to Duke. Holy Cross dropped 8 spots to #85. Maryland dropped 9 spots to #75. 

For stats people who want to know - Our rankings work similarly to the modern www.kenpom.com. Each team starts with a + or - based on how many points better or worse they appear than the average great team in the game. They then get a game score for each game - which basically means if a team is a +10 to start, and then they win by 3 points against a +2 opponent, the initial game score adds their margin of victory or defeat to the opponents plus or minus which in that case is a total +5 (3+2) so in pomeroy that would lower their tati g slightly from +10. However we give a bonus 5 points for winning the game so in that game the team would be a +10 game score so the rating would stay the same. The losing team gets a -5 beyond the initial game score.

One other team that moved up one spot was Niagara - from 136th to 135th. This happened because we realized we've been listing NC State twice which made it look like 136 teams instead of 135.

All game scores are tracked here.

RnkTeam - Year - Star PlayerRatingWinsLossesAve PtAve AllowSoSChange
1Kansas - 2008 - Mario Chalmers16.25174.756.0-0.70
2UCLA - 1972 - Bill Walton15.36072.062.0-0.50
3Duke - 2001 - Shane Battier13.02084.574.0-1.00
4Kentucky - 1996 - Antoine Walker11.00164.067.0-2.01
5Villanova - 2018 - Mikal Bridges11.07279.470.30.11
6Kansas - 1997 - Paul Pierce10.53075.360.3-7.01
7Indiana - 1976 - Scott May10.13171.359.8-0.82
8North Carolina - 2005 - Sean May9.83272.264.42.02
9Houston - 1968 - Elvin Hayes9.13173.063.81.32
10Gonzaga - 2017 - Nigel Williams-Goss9.13268.859.40.02
11Duke - 1992 - Christian Laettner9.01171.564.50.52
12Virginia - 2019 - Kyle Guy9.04172.665.42.42
13Cincinnati - 1960 - Oscar Robertson8.41169.573.510.02
14Duke - 2010 - Jon Scheyer8.25274.066.70.13
15Baylor - 2021 - Jared Butler8.02184.073.72.0-7
16Michigan St. - 2000 - Mateen Cleaves7.83088.378.3-3.328
17Connecticut - 2004 - Ben Gordon7.64273.564.0-0.81
18DePaul - 1980 - Mark Aguirre7.53080.367.73.328
19Louisville - 2013 - Russ Smith7.52174.066.31.70
20North Carolina - 1982 - Michael Jordan7.45168.865.04.00
21UNLV - 1991 - Larry Johnson6.21176.575.5-5.00
22Purdue - 2018 - Carsen Edwards5.54171.268.82.82
23NC State - 1974 - David Thompson5.12172.072.74.32
24Auburn - 2019 - Chuma Okeke4.88171.065.3-2.62
25Houston - 1983 - Hakeem Olajuwon4.52170.765.0-0.3-3
26Michigan St. - 1979 - Magic Johnson4.52170.362.7-2.31
27Wake Forest - 1996 - Tim Duncan4.52166.064.76.01
28Illinois - 2005 - Deron Williams4.43272.069.61.21
29Illinois - 1989 - Nick Anderson4.01074.068.06.035
30Memphis - 2008 - Derrick Rose4.04268.765.80.00
31Michigan - 1989 - Glen Rice4.00169.070.01.00
32Kentucky - 2012 - Anthony Davis3.74272.265.7-4.70
33UCLA - 1967 - Lew Alcindor3.61178.084.5-4.0-30
34Connecticut - 1999 - Richard Hamilton3.50160.064.05.0-1
35Michigan - 1965 - Cazzie Russell3.41181.071.52.0-1
36Wisconsin - 2015 - Frank Kaminsky3.32265.063.31.0-1
37Iowa - 2021 - Luka Garza3.31088.069.0-8.0-1
38Loyola Marymount - 1990 - Bo Kimble3.211119.5110.01.5-1
39Oregon - 2017 - Dillon Brooks3.04371.969.91.6-1
40Syracuse - 2003 - Carmelo Anthony2.82176.074.03.0-1
41Arizona - 2015 - Stanley Johnson2.43175.370.5-6.0-1
42Oklahoma - 1985 - Wayman Tisdale2.43175.373.81.8-1
43Arkansas - 1994 - Corliss Williamson2.30178.079.00.0-1
44Missouri - 1982 - Steve Stipanovich2.22069.565.5-0.50
45North Carolina - 1998 - Vince Carter1.82180.783.7-3.0-24
46Cincinnati - 2002 - Jason Maxiell1.62272.871.5-1.50
47Ohio St. - 1960 - Jerry Lucas1.50178.079.0-3.00
48Indiana - 1981 - Isaiah Thomas1.41173.073.02.00
49Michigan St. - 2009 - Draymond Green1.36371.371.91.60
50Georgetown - 1984 - Patrick Ewing0.82167.365.30.00
51Arizona - 1997 - Mike Bibby0.72168.771.0-1.00
52Seton Hall - 1989 - John Morton0.61178.078.01.50
53USC - 2021 - Evan Mobley0.51077.067.0-7.00
54Texas Tech - 2019 - Jarrett Culver0.43265.667.21.20
55Colorado - 2021 - McKinley Wright0.31086.082.04.00
56Michigan - 2013 - Trey Burke0.21270.369.70.30
57Syracuse - 1987 - Rony Seikaly0.22172.368.7-2.00
58Jacksonville - 1970 - Artis Gilmore-0.21178.075.0-2.00
59Loyola-Chicago - 1963 - Jerry Harkness-0.30162.068.0-2.00
60San Francisco - 1956 - Bill Russell-0.50167.074.04.00
61UTEP (Texas Western) - 1966 - Bobby Joe Hill-0.52163.766.06.70
62Ohio St. - 2007 - Greg Oden-0.62370.271.40.60
63Florida - 2006 - Joakim Noah-0.75374.472.0-4.60
64Pittsburgh - 2009 - DeJuan Blair-1.01360.062.32.32
65Dayton - 2020 - Obi Toppin-1.31087.082.0-6.02
66Georgia Tech - 2004 - Jarrett Jack-1.32362.667.43.82
67Purdue - 1969 - Rick Mount-1.30186.087.0-2.02
68Marquette - 1971 - Jim Chones-1.41168.069.03.52
69Georgetown - 2007 - Roy Hibbert-1.51276.775.3-1.72
70Duke - 1986 - Johnny Dawkins-1.801106.0108.0-6.02
71Kansas - 1957 - Wilt Chamberlain-1.81167.574.02.02
72LSU - 1992 - Shaquille O'Neal-2.00185.088.0-6.02
73Marquette - 2003 - Dwyane Wade-2.12273.374.00.02
74Marquette - 1977 - Butch Lee-2.61166.061.5-5.03
75Maryland - 1984 - Len Bias-2.61169.568.51.5-10
76San Diego St. - 2011 - Kawhi Leonard-2.92269.371.8-0.32
77Kansas St. - 2008 - Michael Beasley-3.01175.075.50.52
78St. John's - 1985 - Chris Mullin-3.00175.076.00.02
79South Carolina - 2017 - Sindarius Thornwell-3.51265.365.7-2.02
80Oklahoma St. - 2004 - John Lucas-3.61368.871.0-1.52
81Kentucky - 1948 - Alex Groza-4.21171.081.53.02
82Indiana - 2002 - Jared Jeffries-4.31367.372.81.32
83Oklahoma - 2016 - Buddy Hield-4.91360.367.31.82
84DePaul - 1945 - George Mikan-5.00151.055.07.02
85Holy Cross - 1950 - Bob Cousy-5.01188.089.5-2.0-9
86Maryland - 2002 - Juan Dixon-5.01367.076.30.81
87St. Joe's - 2004 - Jameer Nelson-5.01268.375.7-1.01
88UNLV - 1987 - Armen Gilliam-5.00164.082.0-6.01
89West Virginia - 2010 - Kevin Jones-5.11370.376.00.01
90Iowa - 2002 - Reggie Evans-5.21271.075.31.71
91UCLA - 2006 - Jordan Farmar-5.52366.072.40.41
92Utah - 1998 - Andre Miller-5.50169.079.0-4.01
93Tennessee - 1977 - Bernard King-5.61176.083.02.01
94Oklahoma St. - 1946 - Bob Kurland-5.80180.082.0-10.01
95Texas - 2003 - T.J. Ford-5.81268.776.3-0.31
96California - 1959 - Jack Grout-6.00169.071.0-2.01
97St. Bonaventure - 1970 - Bob Lanier-6.00164.074.0-6.01
98Georgia Tech - 1990 - Dennis Scott-6.30164.082.01.01
99Seattle - 1958 - Elgin Baylor-6.30162.064.00.01
100Virginia - 1981 - Ralph Sampson-6.30161.072.0-3.01
101Wichita St. - 2013 - Fred VanVleet-6.51264.371.31.71
102Alabama - 1977 - Reggie King-6.80170.071.0-3.01
103Davidson - 2008 - Stephen Curry-6.91566.770.80.71
104LSU - 2006 - Glen Davis-7.01266.375.0-0.71
105Notre Dame - 1989 - Orlando Woodridge-7.00168.074.0-6.00
106Marquette - 2011 - Jimmy Butler-7.30182.087.0-1.00
107South Carolina - 1973 - Mike Dunleavy-8.00166.072.06.00
108Notre Dame - 1970 - Austin Carr-8.21267.077.5-10.517
109Indiana St. - 1979 - Larry Bird-8.30169.076.0-3.0-1
110Kansas - 1988 - Danny Manning-8.30158.067.0-4.0-1
111Auburn - 1984 - Charles Barkley-8.41171.577.0-3.5-1
112La Salle - 1954 - Tom Gola-8.80167.076.0-3.0-1
113West Virginia - 1959 - Jerry West-8.80168.069.0-8.0-1
114Wyoming - 1943 - Ken Sailors-8.80160.073.01.0-1
115Brigham Young - 1981 - Danny Ainge-9.00167.077.00.0-1
116North Carolina - 1957 - Lennie Rosenbluth-9.30176.089.0-1.0-1
117Navy - 1986 - David Robinson-9.50161.077.04.0-1
118Villanova - 1985 - Ed Pinckney-9.50165.072.0-2.0-1
119Georgia - 1982 - Dominique Wilkins-9.61170.078.0-1.0-1
120Kentucky - 1970 - Dan Issel-10.001116.0138.0-4.0-1
121George Mason - 2006 - Jai Lewis-10.20359.367.00.3-1
122Arizona St. - 1980 - Byron Scott-10.50164.079.02.0-1
123Arkansas - 1978 - Sidney Moncrief-10.80158.079.0-2.0-1
124Wake Forest - 2005 - Chris Paul-10.80364.385.34.3-1
125Creighton - 2014 - Doug McDermott-11.00366.380.0-1.3-1
126Creighton - 2020 - Ty-Shon Alexander-11.50172.0106.08.00
127Dayton - 1967 - Don May-11.80169.088.01.00
128Louisville - 1980 - Darrell Griffith-11.80152.082.03.00
129LSU - 1970 - Pete Maravich-12.50166.067.01.00
130VCU - 2011 - Bradford Burgess-13.50360.371.31.00
131Princeton - 1965 - Bill Bradley-13.80162.079.0-3.00
132Butler - 2010 - Gordon Hayward-14.20354.776.34.30
133Loyola-Chicago - 2018 - Cameron Krutwig-14.50359.375.01.70
134Miami FL - 1965 - Rick Berry-15.301104.0108.0-16.00
135Niagara - 1970 - Calvin Murphy-16.50168.084.06.00

Friday, June 17, 2022

Kansas Overcomes Olajuwan's 9 blocks, 18 rebounds

 Hakeem Olajuwon set a game record with 9 blocked shots and added 18 rebounds in the greatest defensive performance we've had in the Value Add Basketball Game.

However, Paul Pierce's 1997 Kansas squad played defense of their own with 13 steals to win the turnover battle 22-10 and defeated the Houston 1983 Phi Slamma Jamma squad 64-59 to advance to our Final Four.

The key moment occured with 4:58 (7 possessions) left when Clyde Drexler hit a 3-pointer to pull Houston within 57-58, but then fouled out guarding Pierce at the other end.

Twice after that Kansas scored on plays with a 31 die roll on the two 6-sided dice which would have led to a steal by Drexler and fast break due to his highest possible 11-20 steal range, but his replacement Benny Anders' worst steal range (11-10) meant the best steal ranges in the game were Michael Young and Larry Micheaux (11-15) allowed Kansas to score.

Normally steals only occur on a roll of 11-16 in the defenders range, but a roll of 31 is only a steal if any defender is an 11-20 steal.

Houston did cut it to 60-59, and with 1:30 (3 possessions) to play and Olajuwan had his record 9th rejection on a roll of 32 (which like the 31 for steals is the universal block number for any block 11-30 on the court which Olajuwon is). However Pierce grabbed the offensive rebound and scored to make it 62-59 en route.to the 64-59 win that sent Kansas to our Final Four.


Thursday, June 16, 2022

Developing - KS 97 vs Houston for last Final 4 spot vs. Duke 2001; DePaul 1980 vs MSU 2000 in other game

Developing - Kansas 1997 will face Phi Slama Jama Houston 1983 for last Final 4 spot vs. Duke 2001. We will add results when the game is played.

DePaul 1980 vs MSU 2000 will face off in the other game.

Michigan State's 2000 Big Ten MVP Peterson Destroys UNC

 Michigan State won all 2000 nine tournament games (Big Ten and NCAA) by at least 9 points, and they also blew out UNC's squad from two years earlier 84-66.

The last Big Ten national title winner featured conference MVP Morris Peterson, who even Vince Carter couldn't handle as he put up 30 points. On defense one of the best steals guys ever, Mateen Cleaves (steal 11-20) had four steals including 2 in a row with 10 minutes left.

We played the game right after Golden State won the NBA title.


Jay Williams, Battier and Boozer cool off Baylor 89-79

 After the tournament top seed UCLA 1967 was upset, the 2-seed Duke 2001 had to face the Baylor 2021 team that had destroyed their first two opponents.

Baylor's victims were both from 1981, as they ran over Notre Dame 91-68 and Indiana 82-64

 However Duke's Jay Williams handled Baylor's pressure and with 2:30 to go in the first half had the perfect play with a steal and 4-point play at the other end after being fouled and hitting a 3-pointer. That made it 35-29 Duke, and by halftime it was 42-31. Duke would lead by double digits the entire second half until a few baskets in the final two minutes.

Shane Battier matched Williams 23 points, while Carlos Boozer added 17 in the win.


Tuesday, June 14, 2022

246th game biggest shocker as Jabbar fouls out guarding Cummings

 The 246th Value Add Basketball Game we've played since inventing the game was the biggest upset.

Kareem Abdul-Jabbar's 1967 UCLA team led 45-40 with 15:01 (25 possessions) left to play against 1980 DePaul when Terry Cummings drew a 5th foul on Jabbar (Lew Alcindor at the time).

With Jabbar out, rolls of 7 or 8 on the 8-sided die no longer goes to anyone, forcing a second die roll. By game rolls, in this case if the second roll is 6-8 the possession ends in a shot clock turnover.

DePaul's defense was already forcing turnovers and preventing UCLA from getting the ball inside - becoming the first great team we recall to have a double digit edge in turnovers forced (23-11).

DePaul scored on fast breaks on most of their 9 steals and Cummings had 3 traditional 3-point plays (he is an 85% free throw shooter as 1-17 is good and only 18-20 is a miss.

With Jabbar out DePaul won the last 15 minutes of the game 46-26 to advance to our Final 4 with an 86-71 shocker.

Like in real basketball results can be completely different from game to game such as this Big East triangle:

UConn 2004 dominated Villanova 2018 on the boards in a 73-56 blowout.

Louisville 2013 speed killed UConn 74-61.

Add those up and it would appear UConn was 31 points better than Nova, however when they played Nova won 77-73 and then in our first 96-team tournament Nova went much further than the other two and all the way to the Final 4.


Pictures of Player Cards for all Elite 8 Teams

The following are the Elite 8 teams of our third Value Add Basketball Game Tournament.

The first tournament was between our initial 96-teams, at which time we only allowed a maximum of one team per school per century. The All-Time Elite 8 of those 96 initial teams were Houston 1968, Indiana 1976, Michigan State 2009, North Carolina 1982, Texas Western (later UTEP) 1966, UCLA 1972, Villanova 2018 and Virginia 2019. In the final, Bill Walton's UCLA defeated Michael Jordan's UNC.

The second tournament we played was a 68-team tournament between the 2020 teams after Covid cancelled March Madness. The 2020 Elite 8 teams looked very realistic, with Baylor, Creighton, Dayton, Duke, Indiana, Iowa, Kansas and Oregon - though a couple of upsets in the Elite 8 led a hot shooting Creighton team past Duke for the title.

This third tournament is between 30 new teams we created last to add to the set to make 136 total all-time great teams (this does not include the 2020 teams, except we added Creighton for winning the 2020 tournament. However, it did include the 2021 Baylor national champions. For these eight we show the match-up, and then the cards of the two teams.

UCLA 1967 vs. DePaul 1980 - Because we only included one school team from one century in the first batch, we included Bill Walton's team  but did not include Kareem Abdul-Jabbar - at the time Lew Alcindor - in the first set. They went into this 30-team tournament as the top seed but struggled a bit in their first game. They are now heavily favored against DePaul. 

Update: see details of the biggest shocker of our first 246 games as Terry Cummings drew a 5th foul on Kareem Abdul-Jabbar with 15 minutes to play to spark a 86-71 stunner.


North Carolina 1998 vs. Michigan State 2000 - Likewise you could not include the incredible UNC 1998 team in the first batch because we had to include Michael Jordan's 1982 team - which was runner up in the first tournament to Walton's UCLA. We could have another UNC vs. UCLA in the Final Four of this tournament if both win, but the 2000 Michigan State team was one of the most dominant in tournament history - winning all three Big Ten tournament games and all six March Madness games by at least 9 points. They were kept out of the first batch because Magic Johnson's Spartans had to be included, and technically 2000 is the last year of the past century, not part of the current century.

Update: Michigan State dominated 84-66 behind Big Ten MVP Morris Peterson. Click for details.


Duke 2001 vs. Baylor 2021 - This Duke should have been in the first batch but we honestly kind of lost 2001 and 2002 between the last century teams and the teams of the www.kennpom.com era. However, they are loaded. Baylor was the last team created, and they simply destroyed their first two opponents but we are waiting to see if they are really that good.

Update: click here for details on Duke blitzing Baylor 89-79.


Kansas 1997 vs. Houston 1983 - Another blue blood in our Elite 8 is Kansas, but they have no easy path as they match up against Phi Slamma Jamma from Houston, which is one of the teams that very likely would have won the tournament with the current double bonus rules. Back then you could foul forever to give a team like Houston one-and-ones instead of letting them run up and down the court and score - which is what Jimmy Valvano did to beat them in the national title.

Click here for details on Kansas overcoming Houston despite Hakeem Olajuwon's incredible 18 round, 9 blocked shot performance.


Flying Illini 1989 cards - fixed typo on star player

 A reader pointed out my sheet of teams had accidentally listed Orlando Woolridge with the Flying Illini 1989 squad. Thank you for the catch!

Woolridge's player card was in the correct spot with Notre Dame, it was just a typo in our game log and standings.

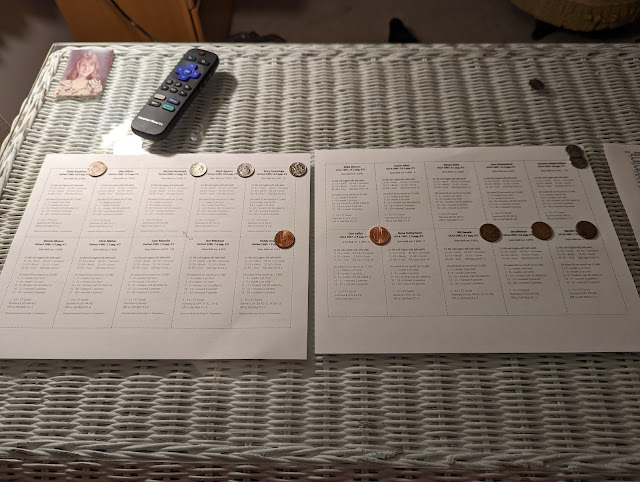
That great team alley-ooped their way to fast breaks all the way to the national semifinal, where they lost 83-81 to a Michigan team they had beaten twice. We changed the reference to Nick Anderson on the scoresheet, but it could have been any player on one of the most talented teams ever. Here are the starting 5.


Sunday, June 12, 2022

Elite 8 Set: Michigan State 2000 Dominates (as always) Len Bias

People are more familiar with the Michigan State teams of Magic Johnson and Draymond Green, but the 2000 Spartans were not only the last Big Ten team to win the NCAA title - but very few teams in history have so dominated their tournament runs. In their last 9 games of the year to run through the Big Ten and NCAA - their closest win was by 9 points against Wisconsin.

In our tournament going up against one of the greatest front courts of all time - Adrian Branch, Len Bias and Ben Coleman or Maryland 1984 - they cruised to a 73-65 win to advance and play the 1998 UNC team in the Elite 8 - which is now set.

Morris Peterson led the way with 23 points, most importantly drawing Branch's fifth foul with 8:54 to go in the game on a 3-point shot, and then hitting all three free throws to make it 58-52 Spartans. With 2:07 to play Peterson hit another 3-pointer and then came up with a steal and scored at the other end to make it 73-64 - en route to the 73-65 win. Double digit scoring by the backcourt with Mateen Cleaves (12 points, 2 steals) and Charlie Bell (16,3) offset the combined domination around the basket by Bias and Coleman (combined 34 points and 21 rebounds to only 17,11 for the Spartans counterparts).


Here is the complete scoresheet for the game.


The log of all games is here.