| Rnk | Top 100 Defenders | Team | Height | Conf | Class | AdjD |
|---|---|---|---|---|---|---|
| 1 | Matisse Thybulle | Washington | 6-foot-5 | P12 | 4 Sr | -4.45 |
| 2 | Ethan Happ | Wisconsin | 6-foot-10 | B10 | 4 Sr | -4.32 |
| 3 | Zion Williamson | Duke | 6-foot-7 | ACC | 1 Fr | -4.14 |
| 4 | Nicolas Claxton | Georgia | 6-foot-11 | SEC | 2 So | -4.11 |
| 5 | Dedric Lawson | Kansas | 6-foot-9 | B12 | 3 Jr | -4.04 |
| 6 | Tyler Bey | Colorado | 6-foot-7 | P12 | 2 So | -3.89 |
| 7 | Matt Mooney | Texas Tech | 6-foot-3 | B12 | 4 Sr | -3.8 |
| 8 | Bruno Fernando | Maryland | 6-foot-10 | B10 | 2 So | -3.72 |
| 9 | Jon Teske | Michigan | 7-foot-1 | B10 | 3 Jr | -3.68 |
| 10 | Matt Rafferty | Furman | 6-foot-8 | SC | 4 Sr | -3.61 |
| 11 | Ty Jerome | Virginia | 6-foot-5 | ACC | 3 Jr | -3.59 |
| 12 | Ed Polite | Radford | 6-foot-5 | BSth | 4 Sr | -3.57 |
| 13 | Brandon Clarke | Gonzaga | 6-foot-8 | WCC | 3 Jr | -3.5 |
| 14 | Jordan Murphy | Minnesota | 6-foot-7 | B10 | 4 Sr | -3.48 |
| 15 | Aric Holman | Mississippi St. | 6-foot-10 | SEC | 4 Sr | -3.46 |
| 16 | Daniel Gafford | Arkansas | 6-foot-11 | SEC | 2 So | -3.41 |
| 17 | Brandon Gilbeck | Western Illinois | 7-foot-0 | Sum | 4 Sr | -3.4 |
| 18 | Xavier Tillman | Michigan St. | 6-foot-8 | B10 | 2 So | -3.39 |
| 19 | Jeromy Rodriguez | East Tennessee St. | 6-foot-7 | SC | 3 Jr | -3.33 |
| 20 | Trent Forrest | Florida St. | 6-foot-4 | ACC | 3 Jr | -3.29 |
| 21 | Braxton Key | Virginia | 6-foot-8 | ACC | 3 Jr | -3.28 |
| 22 | Josh Reaves | Penn St. | 6-foot-5 | B10 | 4 Sr | -3.24 |
| 23 | Bol Bol | Oregon | 7-foot-2 | P12 | 1 Fr | -3.22 |
| 24 | Cortez Edwards | Southern Mississippi | 6-foot-2 | CUSA | 4 Sr | -3.18 |
| 25 | Kevarrius Hayes | Florida | 7-foot-9 | SEC | 4 Sr | -3.13 |
| 26 | Zavier Simpson | Michigan | 7-foot-0 | B10 | 3 Jr | -3.12 |
| 27 | Grant Williams | Tennessee | 6-foot-7 | SEC | 3 Jr | -3.1 |
| 28 | Chuma Okeke | Auburn | 6-foot-8 | SEC | 2 So | -3.1 |
| 29 | Ebuka Izundu | Miami FL | 6-foot-10 | ACC | 4 Sr | -3.08 |
| 30 | Barry Brown | Kansas St. | 6-foot-3 | B12 | 4 Sr | -3.07 |
| 31 | Nick Rakocevic | Southern California | 6-foot-11 | P12 | 3 Jr | -3.07 |
| 32 | Kylor Kelley | Oregon St. | 7-foot-0 | P12 | 3 Jr | -3.06 |
| 33 | Nickeil Alexander-Walker | Virginia Tech | 6-foot-5 | ACC | 2 So | -3.06 |
| 34 | Nate Grimes | Fresno St. | 6-foot-8 | MWC | 3 Jr | -3.05 |
| 35 | Charles Bassey | Western Kentucky | 6-foot-11 | CUSA | 1 Fr | -3.04 |
| 36 | Tariq Owens | Texas Tech | 6-foot-10 | B12 | 4 Sr | -3.03 |
| 37 | Dylan Windler | Belmont | 6-foot-8 | OVC | 4 Sr | -2.98 |
| 38 | Jordan Nwora | Louisville | 6-foot-7 | ACC | 2 So | -2.95 |
| 39 | Marcus Santos-Silva | Virginia Commonwealth | 6-foot-7 | A10 | 2 So | -2.92 |
| 40 | Alpha Diallo | Providence | 6-foot-7 | BE | 3 Jr | -2.91 |
| 41 | Dhamir Cosby-Roundtree | Villanova | 6-foot-9 | BE | 2 So | -2.89 |
| 42 | Dylan Osetkowski | Texas | 6-foot-9 | B12 | 4 Sr | -2.87 |
| 43 | Cameron Krutwig | Loyola Chicago | 6-foot-9 | MVC | 2 So | -2.87 |
| 44 | RJ Williams | Boise St. | 6-foot-7 | MWC | 2 So | -2.87 |
| 45 | Isaiah Roby | Nebraska | 6-foot-8 | B10 | 3 Jr | -2.86 |
| 46 | Nate Renfro | San Francisco | 6-foot-8 | WCC | 4 Sr | -2.86 |
| 47 | Javon Bess | St. Louis | 6-foot-6 | A10 | 4 Sr | -2.84 |
| 48 | King McClure | Baylor | 6-foot-3 | B12 | 4 Sr | -2.82 |
| 49 | Tre'Shawn Thurman | Nevada | 6-foot-8 | MWC | 4 Sr | -2.81 |
| 50 | Tristan Clark | Baylor | 6-foot-9 | B12 | 2 So | -2.77 |
| 51 | Kamar Baldwin | Butler | 6-foot-1 | BE | 3 Jr | -2.76 |
| 52 | Shaq Buchanan | Murray St. | 6-foot-3 | OVC | 4 Sr | -2.75 |
| 53 | Elijah Childs | Bradley | 6-foot-7 | MVC | 2 So | -2.74 |
| 54 | Neemias Queta | Utah St. | 6-foot-11 | MWC | 1 Fr | -2.74 |
| 55 | BJ Stith | Old Dominion | 6-foot-5 | CUSA | 4 Sr | -2.73 |
| 56 | Jehyve Floyd | Holy Cross | 6-foot-8 | Pat | 4 Sr | -2.72 |
| 57 | Xavier Sneed | Kansas St. | 6-foot-5 | B12 | 3 Jr | -2.72 |
| 58 | Talen Horton-Tucker | Iowa St. | 6-foot-4 | B12 | 1 Fr | -2.71 |
| 59 | PJ Washington | Kentucky | 6-foot-8 | SEC | 2 So | -2.7 |
| 60 | Zylan Cheatham | Arizona St. | 6-foot-8 | P12 | 4 Sr | -2.69 |
| 61 | Tacko Fall | Central Florida | 7-foot-6 | Amer | 4 Sr | -2.66 |
| 62 | Alexis Yetna | South Florida | 6-foot-8 | Amer | 1 Fr | -2.64 |
| 63 | Tres Tinkle | Oregon St. | 6-foot-8 | P12 | 3 Jr | -2.63 |
| 64 | Juwan Morgan | Indiana | 6-foot-8 | B10 | 4 Sr | -2.62 |
| 65 | Jaime Echenique | Wichita St. | 6-foot-11 | Amer | 3 Jr | -2.62 |
| 66 | Tyrese Haliburton | Iowa St. | 6-foot-5 | B12 | 1 Fr | -2.59 |
| 67 | Trhae Mitchell | South Alabama | 6-foot-6 | SB | 3 Jr | -2.58 |
| 68 | Oshae Brissett | Syracuse | 6-foot-8 | ACC | 2 So | -2.56 |
| 69 | Keith Braxton | St. Francis PA | 6-foot-5 | NEC | 3 Jr | -2.55 |
| 70 | Jordan Goodwin | St. Louis | 6-foot-3 | A10 | 2 So | -2.53 |
| 71 | Jarrett Culver | Texas Tech | 6-foot-6 | B12 | 2 So | -2.52 |
| 72 | Brekkott Chapman | Weber St. | 6-foot-9 | BSky | 4 Sr | -2.52 |
| 73 | Anthony Lawrence | Miami FL | 6-foot-7 | ACC | 4 Sr | -2.52 |
| 74 | Charles Matthews | Michigan | 6-foot-6 | B10 | 4 Sr | -2.52 |
| 75 | Alex Peacock | Texas St. | 6-foot-7 | SB | 4 Sr | -2.51 |
| 76 | Jack White | Duke | 6-foot-7 | ACC | 3 Jr | -2.5 |
| 77 | Brady Manek | Oklahoma | 6-foot-9 | B12 | 2 So | -2.49 |
| 78 | Elston Jones | UC Irvine | 6-foot-9 | BW | 4 Sr | -2.49 |
| 79 | Kenny Goins | Michigan St. | 6-foot-7 | B10 | 4 Sr | -2.49 |
| 80 | Nick Muszynski | Belmont | 6-foot-11 | OVC | 1 Fr | -2.49 |
| 81 | Doug Taylor | Ohio | 6-foot-9 | MAC | 4 Sr | -2.48 |
| 82 | Tamenang Choh | Brown | 6-foot-5 | Ivy | 2 So | -2.47 |
| 83 | Nate Pierre-Louis | Temple | 6-foot-4 | Amer | 2 So | -2.46 |
| 84 | Osun Osunniyi | St. Bonaventure | 6-foot-10 | A10 | 1 Fr | -2.44 |
| 85 | Paschal Chukwu | Syracuse | 7-foot-2 | ACC | 4 Sr | -2.43 |
| 86 | Chuba Ohams | Fordham | 6-foot-8 | A10 | 3 Jr | -2.43 |
| 87 | Mark Vital | Baylor | 6-foot-5 | B12 | 2 So | -2.42 |
| 88 | Sagaba Konate | West Virginia | 6-foot-8 | B12 | 3 Jr | -2.41 |
| 89 | Elijah Mitrou-Long | Texas | 6-foot-1 | B12 | 3 Jr | -2.41 |
| 90 | Donta Hall | Alabama | 6-foot-9 | SEC | 4 Sr | -2.39 |
| 91 | Kaleb Wesson | Ohio St. | 6-foot-9 | B10 | 2 So | -2.38 |
| 92 | Jarrell Brantley | Charleston Southern | 6-foot-7 | BSth | 4 Sr | -2.37 |
| 93 | Elijah Thomas | Clemson | 6-foot-9 | ACC | 4 Sr | -2.36 |
| 94 | Isaiah Livers | Michigan | 6-foot-7 | B10 | 2 So | -2.36 |
| 95 | Chris Silva | South Carolina | 6-foot-9 | SEC | 4 Sr | -2.34 |
| 96 | Jaxson Hayes | Texas | 6-foot-11 | B12 | 1 Fr | -2.34 |
| 97 | Luke Maye | North Carolina | 6-foot-8 | ACC | 4 Sr | -2.33 |
| 98 | Chase Jeter | Arizona | 6-foot-10 | P12 | 3 Jr | -2.33 |
| 99 | James Banks | Georgia Tech | 6-foot-9 | ACC | 3 Jr | -2.32 |
| 100 | Jason Burnell | Jacksonville St. | 6-foot-7 | OVC | 4 Sr | -2.32 |
Sunday, December 30, 2018
Top 100 Defensive Players in College Basketball
Here are the top 100 defenders in college basketball based on calculations at www.valueaddbasketball.com as of December 29, 2018. These are the personal AdjD calculations, which tells you how much each player lowers his team's AdjD at www.kenpom.com. This system was developed in 2011 and explained in this post and has undergone only minor adjustments.
Value Add Basketball Year End Player Calculations
This email went out to our sports list the morning of December 30. To be added to the list, email pudnerjohn@gmail.com with "add to sports list" in the subject field.
Of the 4,095 college players to take the court this season, Dedric Lawson's ability to improve Kansas an average of 13.29 points per game on offense and defense makes him the most valuable player in the country - and here are the 20 most valuable listed at www.valueaddbasketball.com. Look for the CBS 247 story on the top 8 match-up between St. John's Shamorie Ponds and Marquette's Markus Howard, who just scored 62 points in a 29 minute stretch on 13 of 15 three-pointers and 13 of 13 free throws to shoot up the 6th.
In addition to the CBS Sports 247 site, keep up with this blog for coverage of the Value Add Basketball rankings and Statis-Pro baseball projections all year. You can sort www.valueaddbasketball.com by team, conference or even click for past projections and seasons. Click here for the explanation of the Value Add basketball and how it calculates how much worse a teams average score would be if the player were replaced by a bench player on a mediocre team.
The top 5 defensive players in the country, based on their personal AdjD points by which they lower their teams www.kenpom.com rating.
Of the 4,095 college players to take the court this season, Dedric Lawson's ability to improve Kansas an average of 13.29 points per game on offense and defense makes him the most valuable player in the country - and here are the 20 most valuable listed at www.valueaddbasketball.com. Look for the CBS 247 story on the top 8 match-up between St. John's Shamorie Ponds and Marquette's Markus Howard, who just scored 62 points in a 29 minute stretch on 13 of 15 three-pointers and 13 of 13 free throws to shoot up the 6th.
|
In addition to the CBS Sports 247 site, keep up with this blog for coverage of the Value Add Basketball rankings and Statis-Pro baseball projections all year. You can sort www.valueaddbasketball.com by team, conference or even click for past projections and seasons. Click here for the explanation of the Value Add basketball and how it calculates how much worse a teams average score would be if the player were replaced by a bench player on a mediocre team.
The top 5 defensive players in the country, based on their personal AdjD points by which they lower their teams www.kenpom.com rating.
| Top 5 Defensive Players | State | Points stopped AdjD |
| Matisse Thybulle | Washington | -4.45 |
| Ethan Happ | Wisconsin | -4.32 |
| Zion Williamson | Duke | -4.14 |
| Nicolas Claxton | Georgia | -4.11 |
| Dedric Lawson | Kansas | -4.04 |
Sunday, December 23, 2018
Statis-Pro season Master updates for 2019 NL season with rosters and projections
Click here for the new and improved instructions and new 609 pitcher and 619 batter player cards now.
Always click here for the player card on updated rosters, and here for the most current standings and a short summary of each game played to date. To play your own games, just click here and get the needed dice.
In the rugged NL Central, the Cardinals have been the shockingly bad/unlucky team out, as they are rivaling the lowly Marlins for the worst team.
| Team | Division | Wins | Losses | Win% | GB |
|---|---|---|---|---|---|
| Pirates | NL Central | 11 | 7 | 0.611 | 0 |
| Cubs | NL Central | 9 | 6 | 0.600 | -0.5 |
| Brewers | NL Central | 9 | 9 | 0.500 | -2 |
| Reds | NL Central | 7 | 8 | 0.467 | -2.5 |
| Cardinals | NL Central | 5 | 16 | 0.238 | -7.5 |
| Nationals | NL East | 10 | 5 | 0.667 | 0 |
| Braves | NL East | 7 | 5 | 0.583 | -1.5 |
| Phillies | NL East | 6 | 6 | 0.500 | -2.5 |
| Mets | NL East | 7 | 8 | 0.467 | -3 |
| Marlins | NL East | 3 | 9 | 0.250 | -5.5 |
| Diamondbacks | NL West | 11 | 7 | 0.611 | 0 |
| Padres | NL West | 9 | 6 | 0.600 | -0.5 |
| Giants | NL West | 10 | 8 | 0.556 | -1 |
| Dodgers | NL West | 11 | 10 | 0.524 | -1.5 |
| Rockies | NL West | 6 | 12 | 0.333 | -5 |
through Games of February 21
The next games complete our effort to make sure all of the strongest hitting pitchers have batted, and also making sure every AL team has played at least one interleague game so that I am sure to have their projected cards set for anyone else who wants to use them by clicking here.
Good hitting pitchers yet to hit as of February 21
Greinke (Arizona) and Velaszquez (Philadelphia)
Ryu (Dodgers) vs Angels (reliever Hudson a good hitter)
Chacin (Milwaukee) vs Blach (Giants)
DeGrom (Mets) vs Yankees
Arrieta (Phillies) vs Corbin (Nationals)
Syndergaard (Mets) vs TBD
AL Teams yet to play as of February 21
Athletics vs Giants
Orioles vs Braves
Red Sox vs Marlins
So far, even these strongest hitting pitchers in baseball are hitting .211 and slugging .556, with the only hits coming from the following four pitchers - including a home run by CC Sabathia for the Yankees against the Mets anda double by Lorenzen of the much improved Reds team:
| Team | Batting Ave | Slug | OBP | OPS | |
| NYY | Sabathia | 0.500 | 2.000 | 0.500 | 2.500 |
| Cin | Lorenzen | 0.500 | 1.000 | 0.500 | 1.500 |
| Det | Ross | 0.500 | 0.500 | 0.500 | 1.000 |
| StL | Wainwright | 0.333 | 0.333 | 0.333 | 0.667 |
Charts for Statis-Pro Advanced Version Using Dice (if you do not have Fast Action Cards)
We consolidated various sets of instructions on Statis-Pro Baseball game into the following.
Basic Understanding of the Game 1
1. Dice or Fast Action Cards. 2
11-88 number - 11 possible results (hits, balks, Ks, Walks, HBP, WP, PB, Out) 4
Left vs. Right Adjustment 12/88, 88/11 or other. 5
Chance of Error on Hit or Out 6
Once you determine a player who might make an error - E-0 to E-10 6
SR and RR - How Long Can a Pitcher Pitch Before Getting Tired? 10
Taking Extra Bases on Hits, Hit and Runs, or Bunts 11
Clutch Fielding (CD or for catcher CD-C): 14
Z-Play - unusual plays, injuries and tough fielding plays: 14
Statis-Pro Baseball was invented by Jim Barnes in 1970, and in an interview he invited others to adopt and update the game as “open source.” Our free version enables you to either play current teams with projected players, or to choose from 60 all-time great baseball teams. There is a complete game and many seasons of great advanced Statis-Pro cards on the Statis Pro Advanced Facebook page, if you want to try the game here first and consider ordering from them if you determine you like it.
Basic Understanding of the Game
The unique aspect of the game is that each plate appearance starts by determining if the pitcher is in control of the at-bat and his card will be used, or if he “makes a mistake” to put the action on the batter’s card and give him a chance for an extra base hit. An initial roll of two-tradition 6-sided dice or a use of “fast action cards” yield a number of 2-12. The best pitchers keep it on their card on 2-9, while the worst pitchers only control the action on a 2-4. Once you know whether the batter or pitcher card will be used for that at bat, a subsequent roll of two 8-sided dice for a result of 11-88 or a similar number from the fast action card gives the result of the plate appearance.
What you need to play
Dice or Fast Action Cards.
You need one of the three things in these photos. If you choose to use dice, you need two traditional 6-sided dice, two 8-sided dice of different colors, and one 20-sided die. If you prefer to use the free fast action cards we provide, they look like the all-white card below. Others sell much nicer fast action cards, so google “statis-pro baseball fast action cards” and you can find a set for $10 - you can see the blue and green corner of one of those cards and they really do add to the game..

Player Cards
Next, choose the teams you want to play. If you want to play two of the 60 all-time great teams, print the pitchers (see 1995 Braves below) from this pdf (one team to a page) and then follow these directions to print out the batters (see 1927 Yankees below) from a google sheet. If you prefer to play modern players, then choose the pages of the teams you want from all 2022 Projected Batters (49 pages, 9 cards to a page) and All 2022 Projected Pitchers (62 pages, 9 cards to a page) - the cards will have ranges like the Scherzer vs. Betts cards below. So you will be using EITHER team sheets of players or individual cards of players.


How to Play the Game
Setting Up
Choose a player on each team to pitch and play the other 8 positions - C, 1B, 2B, 3B, SS, LF, CF and RF. Next choose if you will use an extra batter as a designated hitter (DH) or have pitchers hit in the game. Once you choose the 9 who will start the game, write them down in the order they will hit from 1st through 9th.
If you are using cards you can shuffle them, but if you printed out our free ones, you may just want to put them all in a big bowl to pull out the cards one at a time. Of course, if you are using the five dice then no shuffling is needed.
If you are using player cards, you can stack the line-up in order. If using team sheets, you may want to use a couple of business cards to put below each batter as they hit.
Order of Play
2-12 number:
Get a result of 2-12 from flipping a card or rolling the dice. If that number falls within the pitcher’s PB rating (pitcher or batter) then the action will occur on the pitcher’s card, and if outside that range it will occur on the batter’s card. The possible PB ranges on pitchers’ cards, from best to worst, are 2-9, 2-8, 2-7, 4-7, 2-6, 2-5 or 2-4.
If you choose to use optional advanced rules, look at the bottom of these rules for CD, BD or Z-plays, which can occur in place of the 2-12 number.
11-88 number - 11 possible results (hits, balks, Ks, Walks, HBP, WP, PB, Out)
On the 2nd card, read the second number (Random Number 11-88) to see what happens on that card, or look at the 8-sided dice for the 11-88 number.. (If noone is one base, change any BK, WP or CD on line 2 to an OUT).
Here are the 10 possible results:
1B = Single
2B = Double (only on batters' cards)
3B = Triple (only on batters' cards)
HR = Home Run (only on batters' cards)
BK = Balk if anyone on base (only on pitchers' cards, if no one on base treat as OUT)
K = Strikeout
W = Walk
CD-C = Catcher Clutch Defense - if not using advanced rules treat as out
HPB = Hit by Pitched Ball (only on pitchers' cards)
WP/PB = Wild Pitch or Passed Ball (only on pitchers' cards, if no one on base treat as OUT)
Out = see below.
If using player cards, the card will also indicate the fielder who gets the ball on a single (1Bf, 1B7, 1B8 or 1B9) or double (2B7, 2B8, 2B9). If using a sheet, the reading is simply 1B or 2B so use the second digit of the number to determine the field. A 1 or 2 (11, 12, 21, 22 etc.) indicates the batter pulled the ball, so a RN or RP hits it to LF, a SN, SP or P to CF and a LN or LP to right. If the last digit is 3 or 4, the hit goes to LF, 5 or 6 goes to CF and 7 or 8 goes to RF.
On old fast action cards, you would check after a WP or BK for a “yes” or “no” result, but skip that step even if using those old cards. If anyone is on base, the WP or BK occurs if it comes up on the card.
Left vs. Right Adjustment 12/88, 88/11 or other.
The Cht numbers at the bottom right of the batter card indicates numbers on which results are adjusted based on if the opposing pitcher is right-handed or left-handed. The standard 12/88 for a left-handed batter indicates that an 11 or 12 is changed from a hit to a strikeout against a left handed pitcher, and an 88 is changed from an out to a single with runners advancing two bases against a right-handed batter. The standard right-handed batter has an 88/11 meaning an 88 against a left-handed pitcher is a single, runners advance two bases while an 11 is changed to a strikeout against a right-handed pitcher. Typically a switch-hitter is –/– meaning no adjustment.
For some batters there are more numbers impacted, for example a 14/85 would be the most extreme possible adjustment, and mean the batter struck out on 11-14 against lefties, and had singles with runners advancing 2 bases on 85-88. Just remember the number to the left of the dash is the adjustment against lefties, and the number to the right of the dash is the adjustment against righties. Further, the number either goes all the way down to 11, or all the way up to 85 from what is listed.
If Result is OUT:
If the result is an OUT, the fast action cards we provide will tell you what type of out is made.
If using the nice Fast Action Cards you produce then the following will tell you what happens to runners on base.
G6A (grounder to short) or any other A at the end of a grounder tells you the batter is out, but all runners advance.
Gx6 or any other reading with an x in the middle indicates runners hold and if there is a force out then the defense can throw out a forced runner. However, if runners are on 1st and 3rd then the defense must choose whether to take the out at second base and let the runner on third score or hold the runner at third and throw out the batter to leave runners on 2nd and 3rd.
G6 or any other reading with no x or A indicates a double play grounder if a runner is on 1st. However, if there is a runner on 3rd and no outs, the defense needs to either hold him and just throw the batter out at 1st, or let him score and turn the double play. If bases are loaded with no outs, the defense can choose to either throw the runner out at home, or take the double play from 2nd to 1st and let him score.
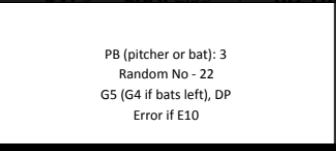
Chance of Error on Hit or Out
An error can occur under any of the three systems you can use for random numbers.
If using dice, any time a 18 or 19 on the 20-sided die is rolled there is a chance for an error. On a hit, the outfielder who fields the ball could make an error to allow an extra base on the hit, while on an Out the player could allow a 1- or 2-base error instead of an out.
On the nice Fast Action Cards you can buy from someone, a * will appear by the out result to let you know to check for errors on the next card. When using those cards, check for an error only on hits on the batter’s card - there is no chance of an error on a hit off the pitcher’s card.
If using the free fast action cards we provide, the Error Reading on the 4th card is only used if; there is a hit on the BATTER card on line 2 OR, there is a possible error (e?) on line 3 with an out. If the fielder's E number is in the range on this 4th line then everyone is safe in an out or gets an extra base on a hit. Flip for another 11-88 and if the number is 61-88 give batter and runners one additional base for a throwing error.
Once you determine a player who might make an error - E-0 to E-10
If there is a chance of an error on a player, then the next fast action card will determine if the error is in the player's range. A player can have anywhere from an E-0 (the best, never makes an error) to the worst E-10. If using the fast action cards, the next card will tell you if the error is in that range (e.g. Error 3-10 would be an error for an E-3 but not for an E-2).
If using dice, the 20-sided die determines the same thing with a roll of 3 meaning the same as a 3-10 range is an error. If the roll is 10 or higher, then subtract 10 but if it is an error then it is in the range. So a 13 die roll would be a 2-base error for an E-3, but no error at all for an E-2.
Obviously you cannot have a double play with noone on base, pardon the type under “1” with bases empty, just a grounder from shortstop to first base.


SR and RR - How Long Can a Pitcher Pitch Before Getting Tired?
The SR number is used for a starting pitcher, and RR used for a relief pitcher to see when they tire in a game.
For example, Greg Maddux on the sheet above would start at 15 or his SR.
This number is lowered by 1 every time the pitcher:
Allows a runner to reach 1st base (unless on an error that is not his fault)
Allows an earned run
An inning ends while he is pitching (whether he started that inning, or cam in after it started)
Once a pitcher’s SR or RR is reduced to 0, his PB drops by 1, and then every additional education from one of those three occurs it is reduced by one more. If a pitcher started with the best rating of PB 2-9, then when he hit zero he would drop to PB 2-8, and then to 2-7, 4-7, 2-6, 2-5, 2-4, 2-3, 2-2 and if reduced further then the rest of the batters faced would skip the 2-12 number and automatically go to the 11-88 on the batter’s card.
Allows a runner to reach 1st base (unless on an error that is not his fault)
Allows an earned run
An inning ends while he is pitching (whether he started that inning, or cam in after it started)
Taking Extra Bases on Hits, Hit and Runs, or Bunts
Normally after getting the result you move onto the next batter. However, you can opt for any of the following strategies to advance base runners rather than going immediately to the next batter and the next 2-12 number.
Here are charts with various options. Note I have made some changes in writing after reviewing stats on frequencies of various scenarios.
On bunts, we do have some all-time great players whose Sac (bunt) rating is AA+. The first time an AA+ player bunts in a game, use the AA column on the sacrifice chart BUT on an 11-28 he is safe at first base on a single.
When a runner tries to take an extra base on a hit, the chart is used for the numbers on which he makes it to the next base. However, in some cases he cannot make it the extra base, but he is not thrown out either, he just sees a strong throw coming and stops at the base. He is only thrown if the 11-88 number for the throw is a 71-88 from a T-5 throwing arm for the outfielder, or a 75-88 for T-4, 81-88 for a T-3 and finally 85-88 for a T-2. Players advancing or being thrown out in modern baseball is even more rare, with layers taking the next base only 30 percent of the time and only being thrown out 1 percent of the time.


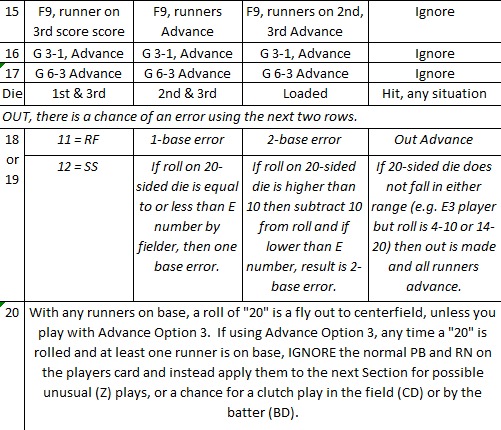
Optional Advanced Rules
You can choose to ignore a BD, CD or Z-play result to keep the game simple. If so, just ignore and play the 2-12 range to use the batter or pitcher card instead.
If you choose to play the advance rules, these can come up instead of the 2-12 number in the following ways.
If using dice, a roll of 20 on the 20-sided dice can overrule the 2-12 rating only if runners are on base.
If using fast action cards, in some cases a BD, CD or Z will come up instead of a 2-12 on some cards. With Fast Action Cards, Z-plays do happen even if noone is on base, but BD or CD is skipped if noone is on base.
Clutch Batting (BD):
If at least one runner is on base and the results is BD, or clutch batting, then the 11-88 number results in one of the following:
If the number would result in a 1B on the batters cards, then make the result is a 2B (double) and all runners on base score.
If the number would result in a 2B, 3B, HR or Deep on the batters card, then change to a home run.
If the number would have resulted in anything else on the batters card, then change to a foul ball, and the batter is still at the plate.
Clutch Fielding (CD or for catcher CD-C):
If the result is a CD-C then use the catcher's clutch defense rating from 1 to 5 but simply score as an Out if noone is on base. If a CD results and anyone is on base, then check to see which fielder has a chance to make a play. The fast action card will indicate which player, but if using dice then refer to the 2-12 number to determine the player. If are using dice to determine which player has a chance for a clutch defensive player, or might commit and error - then use the following numbers:
2 or 3 = 1B, 4 = P, 5 = CF, 6 = 3B, 7 or 12 = SS, 8 = 2B, 9 - LF, 10 = C, 11 = RF.
Once you know the position, use that players CD rating of 1 to 5 then the 11-88 number on the chart below:
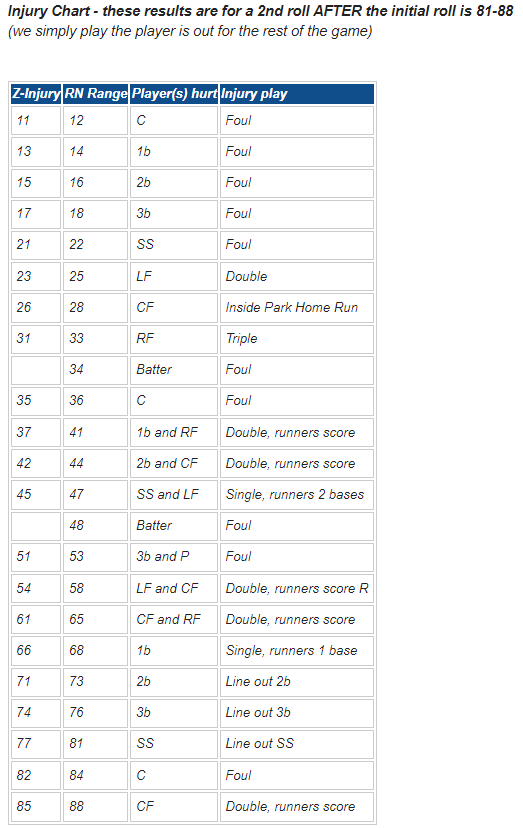
Z-Play - unusual plays, injuries and tough fielding plays:
The following charts are used if an unusual “Z-Play” occurs. Draw a new 11-88 number.

Option to purchase the advanced game
While I provide this game and all the players' cards for free here, we recommend purchasing a full Statis-Pro game from someone who produces all the components along with teams from throughout history. We provide these charts partly so that you can try the Advanced Rules before getting the game from them, but also because the only items that is hard to use based on the PDF they would send you is the Fast Action Deck - so this entire blog makes it possible to play the entire game with the dice as photographed instead of the Fast Action Deck.

Click for a card for every player projected to play in the majors in 2019. We calculated their Clutch Defense and Error ratings in this way.)
Subscribe to:
Posts (Atom)