Sunday, December 25, 2022

Isaiah Thomas' Indiana Rallies Past Garza's Iowa 72-71

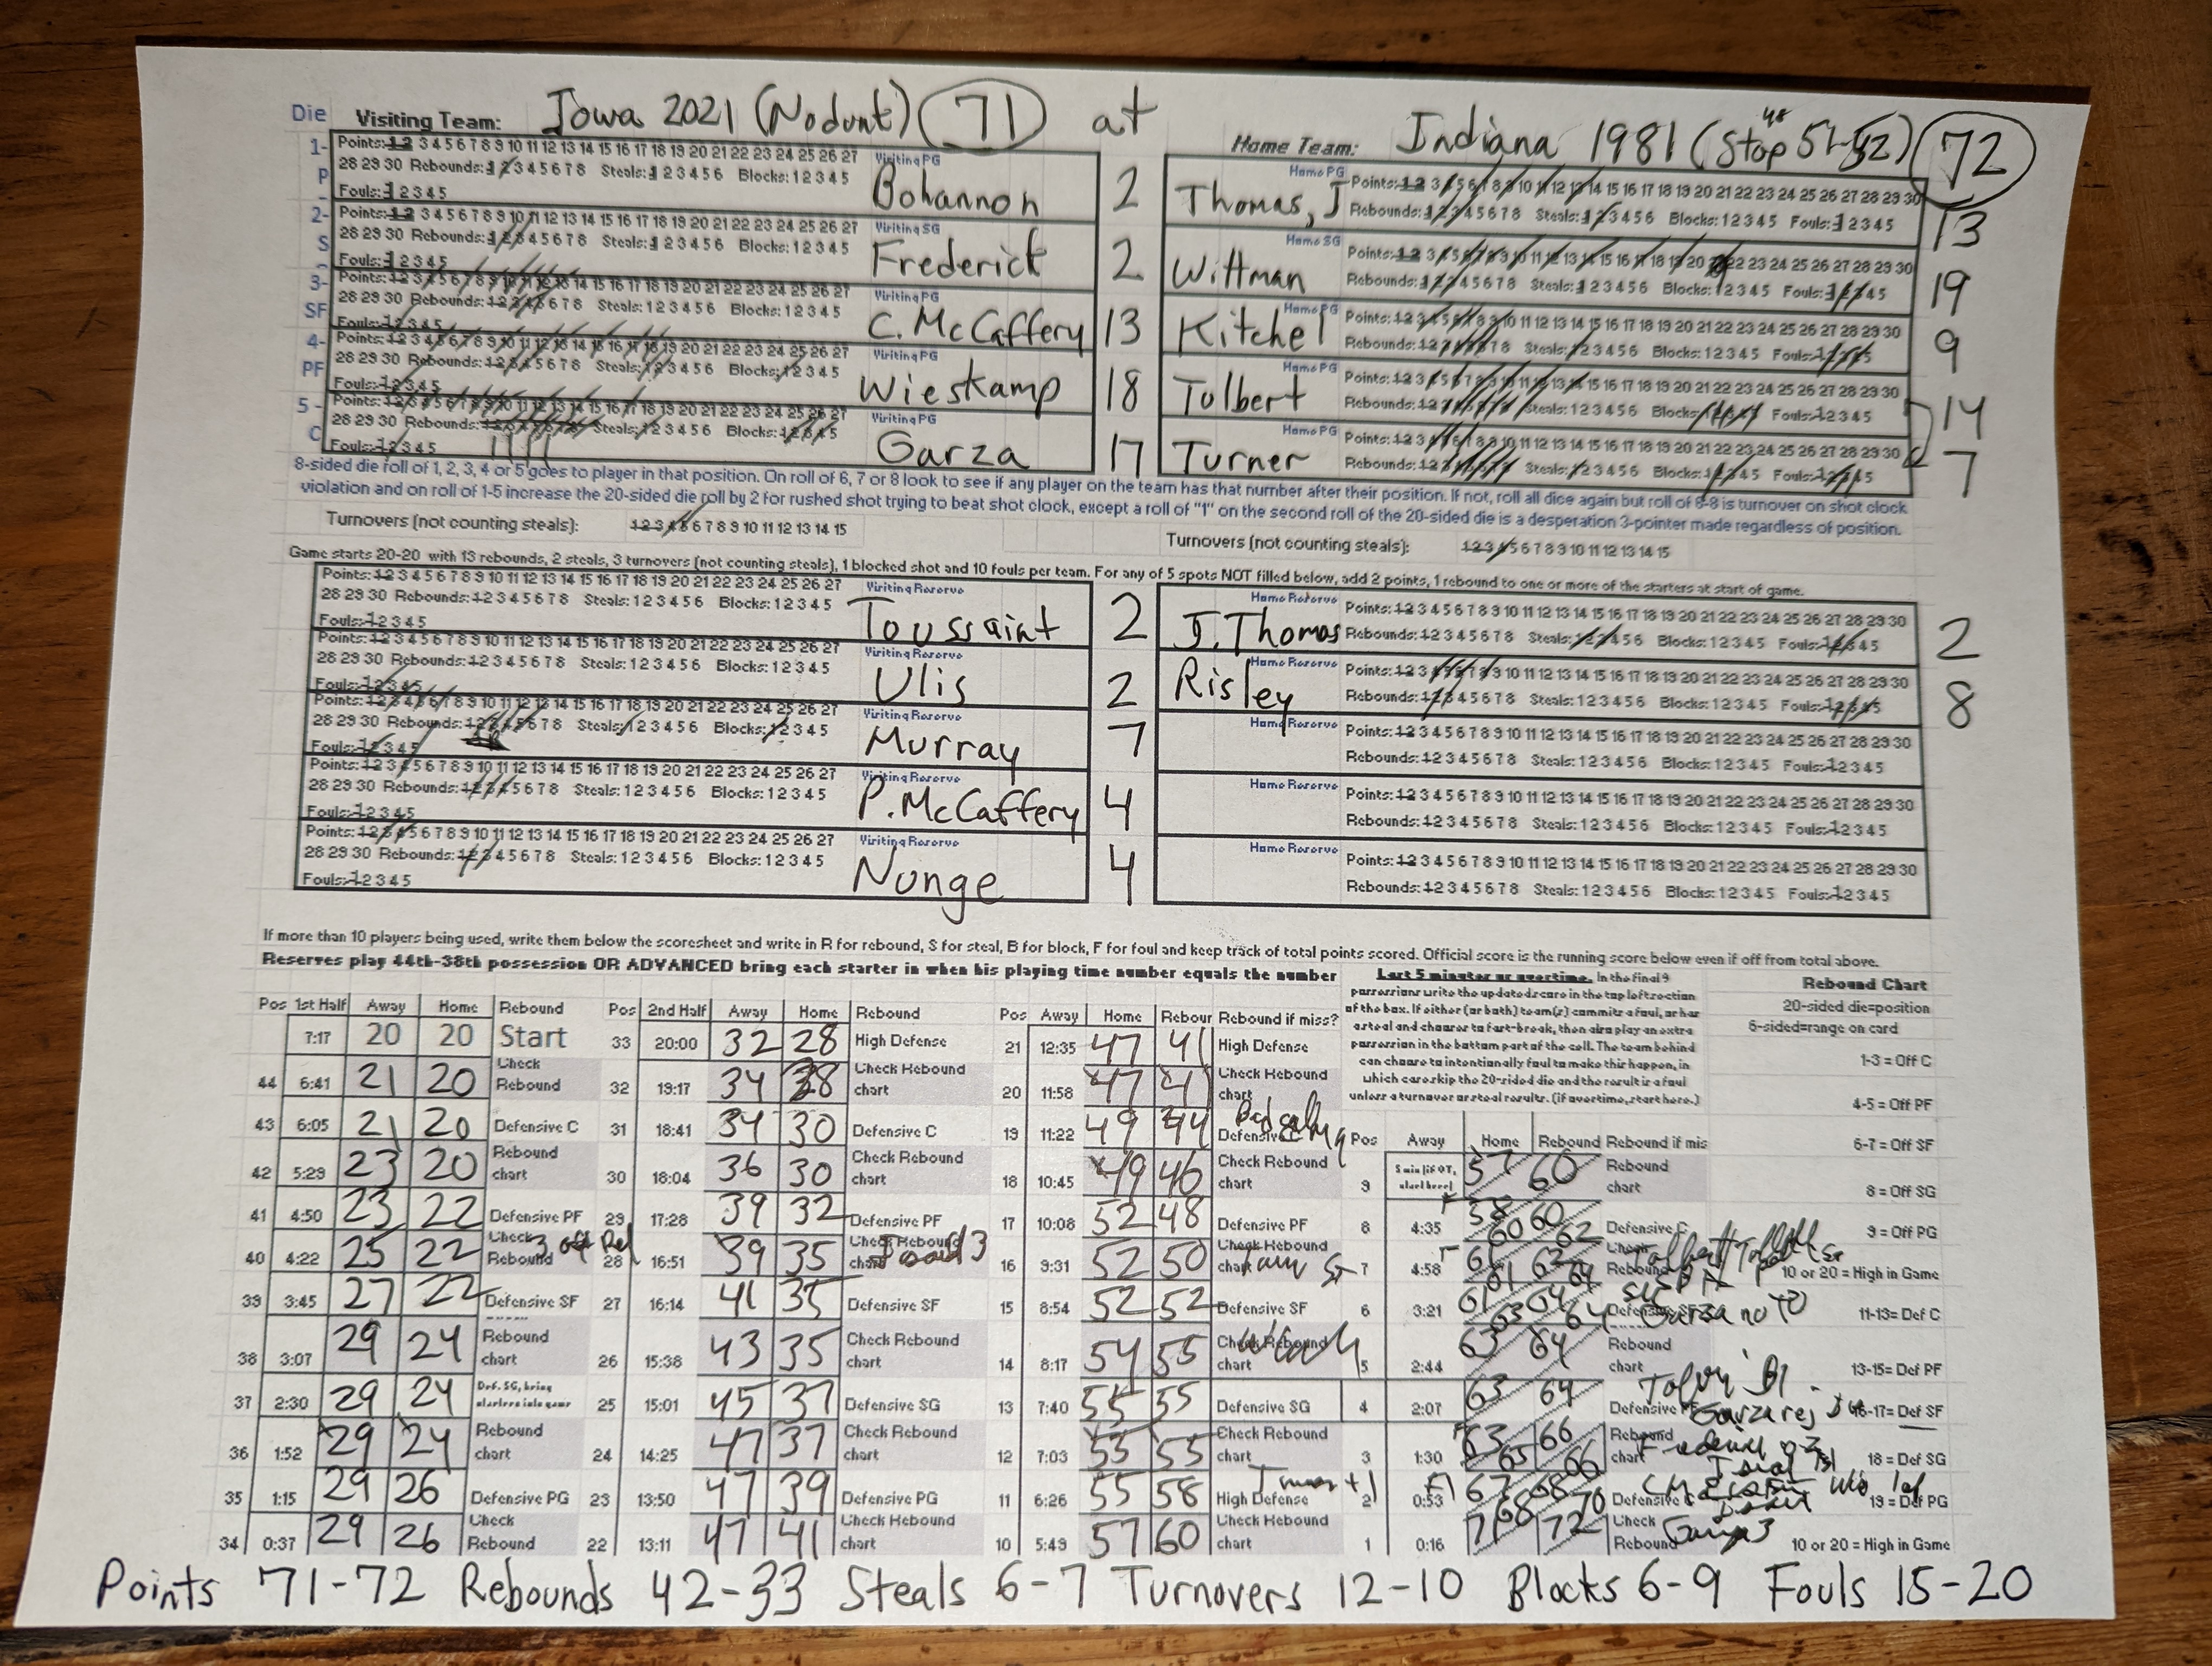
 Randy Wittman's buzzer beating shot delivered a 72-71 win after Luka Garza's 3-pointer seconds earlier gave Iowa the lead. We already did a full preview of the game with tips on setting up the Value Add Basketball Game on this past blog, so here are some strategy tips and highlights.

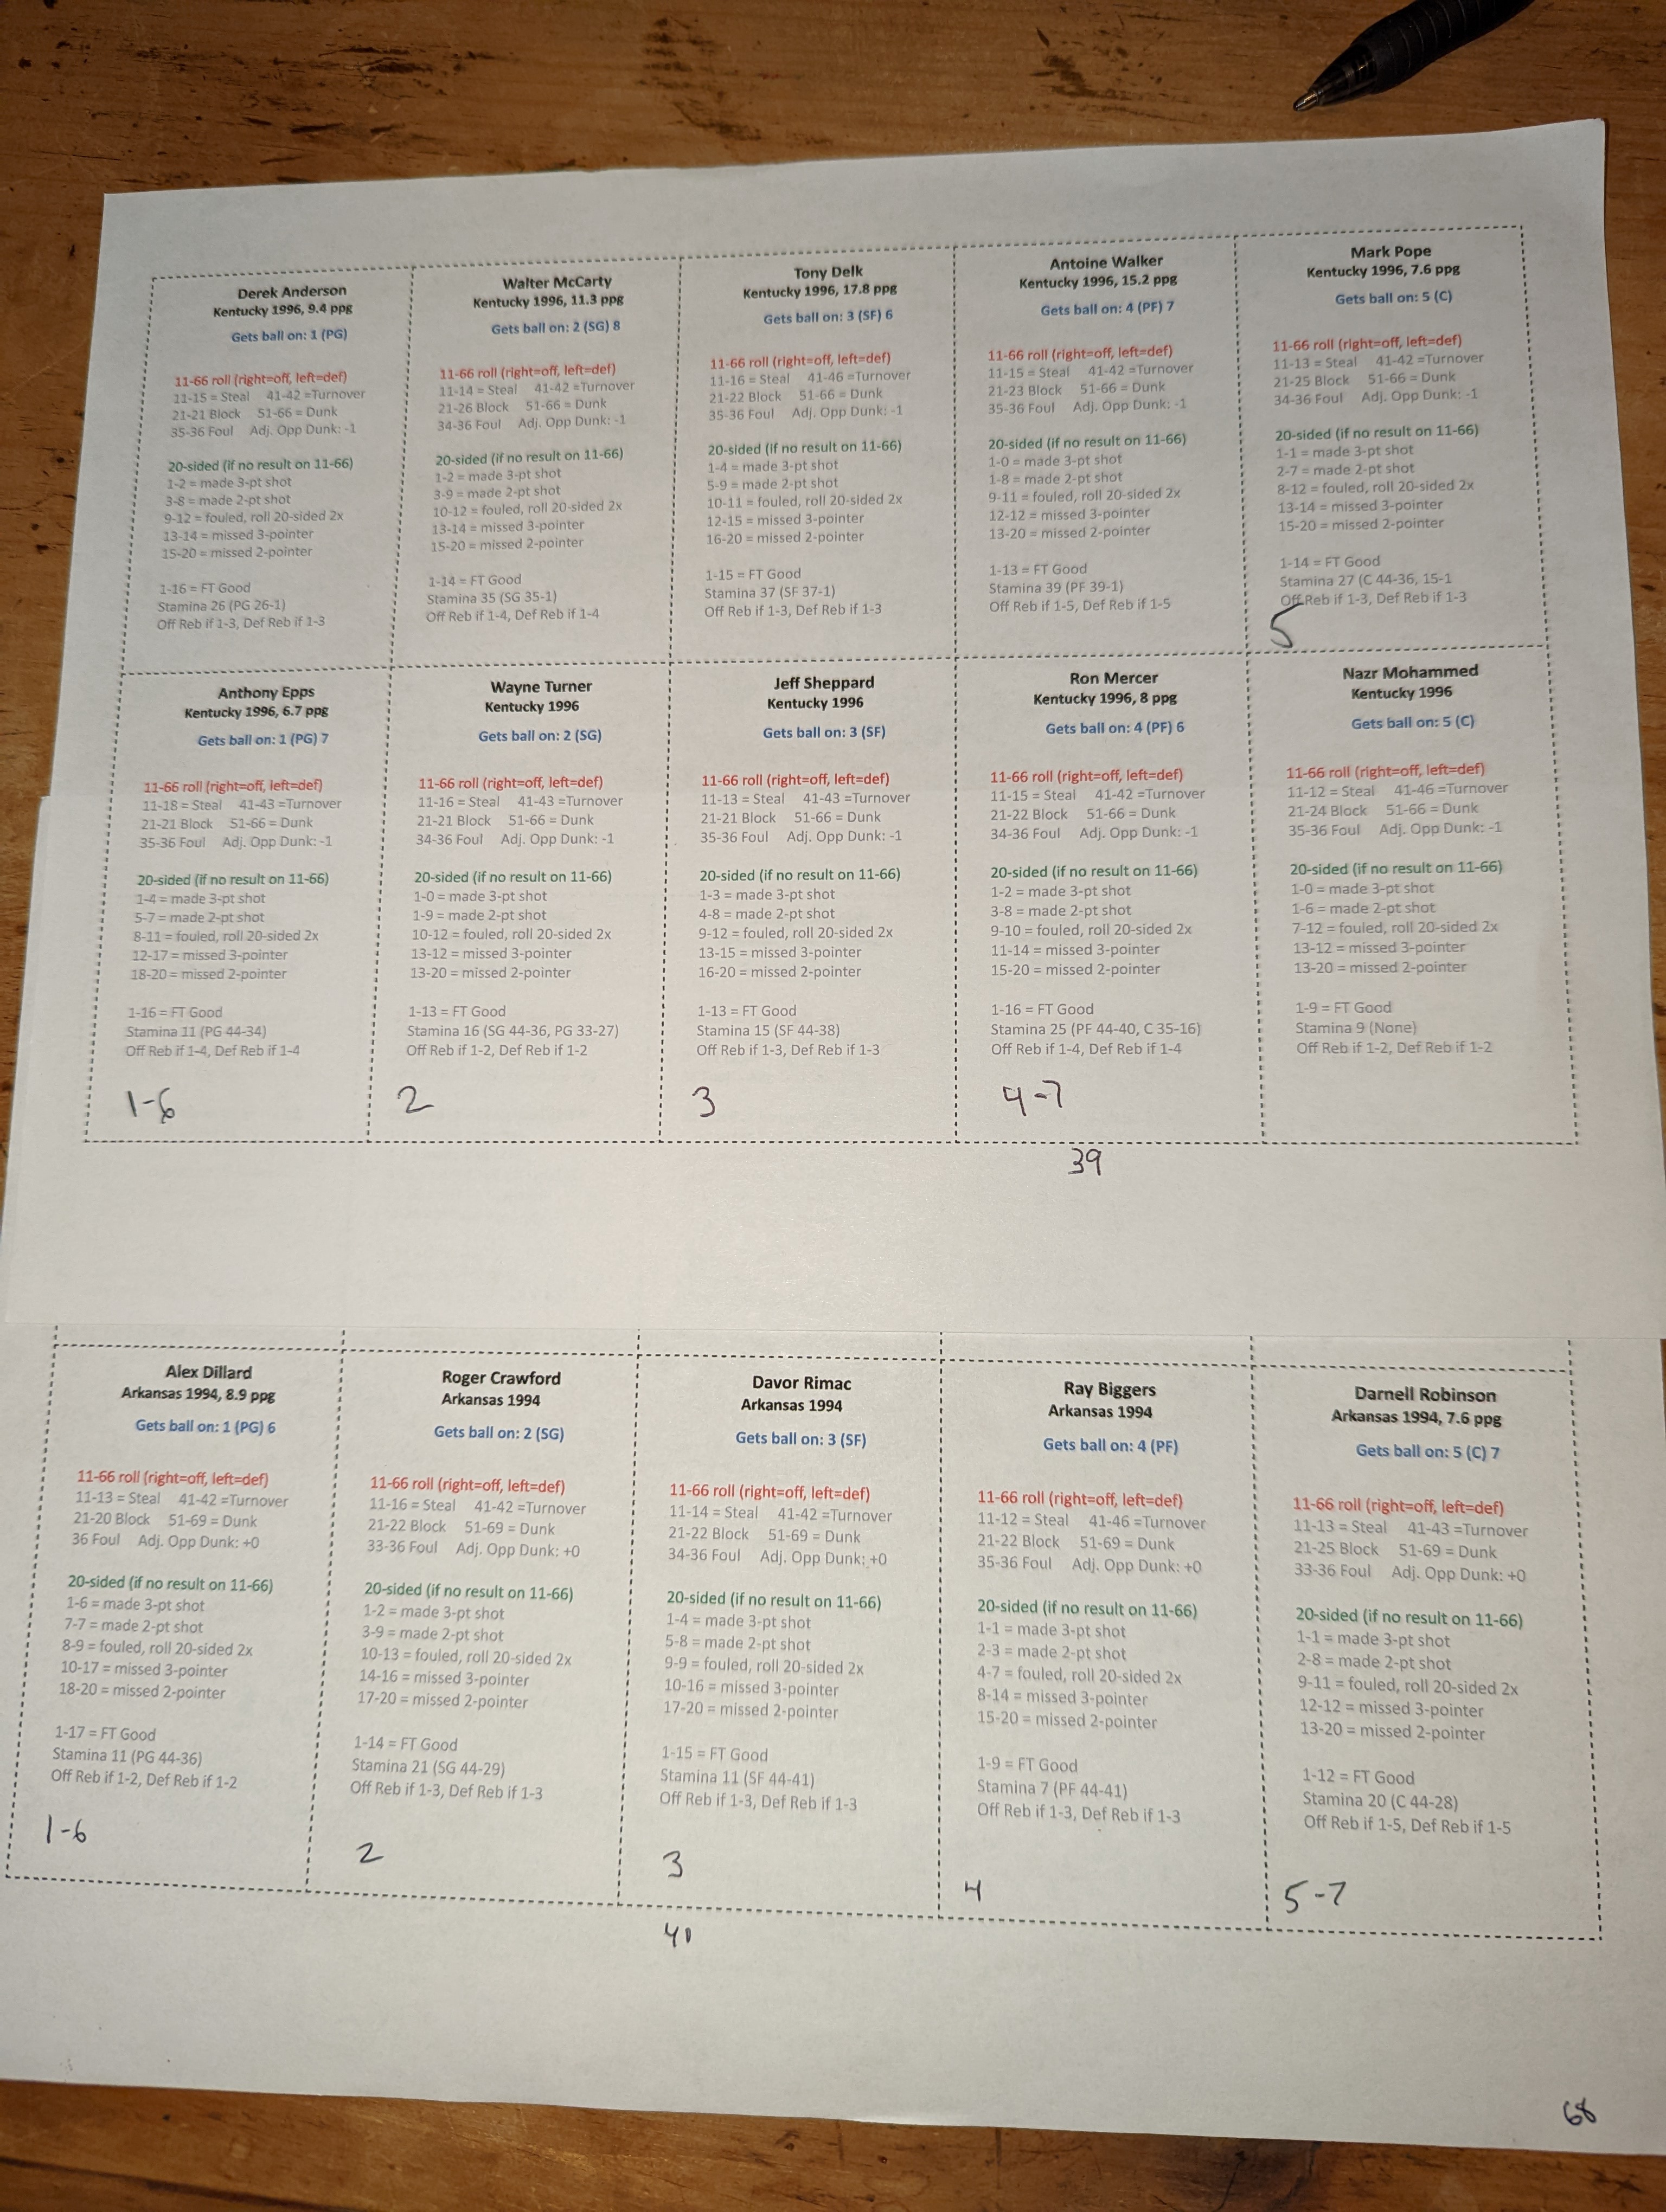
Iowa dominated the front line while Luka Garza was joined by Keegan Murray and Jack Nunge, who all have the top block range (21-30, meaning they block shots on a 21-26 when the player they are guarding as the ball, but also can all block a shot on a 32 no matter which opposing player has the ball). The offensive rebounding range while all three are on the court is an incredible offensive 1-10, 1-9 and 1-15.

They set the ton early on the 40th to last possession (4:22 in the first half) when all three grabbed an offensive rebound before Murray scored. They led 43-35 when the stamina ran out for Murray and Ninge before the final 26 possessions of the game.

However, Isaiah Thomas led Bobby Knight's second national champion in five years back from that point on. Iowa only got one bad call against them as the road team, and that was when Ray Tolbert did score, but a foul was incorrectly called on Iowa defender Joe Wieskamp, giving Tolbert the and-one which he made to cut it to 49-44 with 19 possessions (11:22 left to play).

However, soon thereafter we made a strategy change for Indiana, realizing that while we had set up the game with Landon Turner and center and Ray Tolbert at power forward, it actually made more sense to reverse them and have Tolbert's 1-6 rebound and 21-23 blocked shots at center to lessen the chances of Garza grabbing an offensive rebound and giving a chance at blocking his follow-up shots.

This paid dividends as Tolbert blocked five shots, three times on Garza, and evened up the rebounding a bit down the stretch though Iowa still won the glass 42-33 overall (see stats on bottom of score sheet).

While the backcourt of Isaiah Thomas (13 points) and Randy Wittman (19 points) led the comeback, but it was tougher because Iowa's two guards avoided five plays that would have been a foul on almost anyone else but because they have no fouls on their defensive card (37-36 foul range means no foul range at all) which avoided a foul twice on rolls of 36 when Thomas or Wittman had the ball and three more times when a 66 was rolled which as the home team Indiana could have changed from a 66 to 36 to get a "home job" foul call against most players.

The last few minutes were extremely tight.

With 3:22 to play, Garza avoided a turnover on a "41" as he has no turnovers on the 41-46 turnover range, and then scored to cut it to 63-64. With 1:30 left, Thomas went in for what would have been a score on a "5" on the 1-20 dice, but on the "32" defensive dice let's anyone on the court with a 21-30 block the shot - which Garza did to keep the score 65-66 Indiana.

Iowa's CJ Frederick drew a foul to extend the game but missed both free throws, and then Joe Wieskamp was fouled and made only one of two to tie the game to make it 68-68 with 53 seconds left. Thomas then drove and scored to make it 68-70 Indiana, Garza (17 points, 14 rebounds) hit the three pointer to make it 71-70 Iowa, and Wittman finished the game with a buzzer beater and the 71-72 win.


B10 VABG Reminder Set-up for Game and Home Advantages

For Christmas Day Basketball we decided to use the home advantage advanced rules for some Big Ten match-ups. Under the Value Add Basketball Game rules games can be played on a neutral site, which we have done with most of the games we have tracked.

This blog is a good reminder on how to set up the game - see steps through the end of the blog.

However, we chose to play the following three Big Ten games with a home advantage:

Iowa 2021 at Indiana 1981
Michigan 1989 at Iowa 2021
Illinois 1989 at Michigan 1965

Under these rules, the home team can reverse any role of 36 or 66. If the visiting team has the ball and a "36" comes up, that would usually (but not always) result in the home team committing a foul. The home team can reverse that to a "66" so the referee missed the foul call. The reverse is also true, if the home team has the ball and a 66 is rolled, the home offense can reverse the result to a "36" which means the referee gave them a foul call that should not have been called. 

Over the course of a game, that will result in a few bad calls in favor of the home team, that will result in about a 3-point advantage for the home team.

The reason we picked those teams is that it gets them all to three games played - the teams ranked #1 to #37 have all played between three and nine games, so we are trying to work through and get every great team up to at least three games played.

We can then have Loyola Marymount travel to #49 Missouri, which will mean the top 49 teams have all played at least three games. 

Here are the teams ranked from #38 to #47 all-time. The number to the left is their ranking among all-time great teams in our game. After a key player from their team is listed, we then list their average points score and allowed, and then an overall ranked and their conference. So Michigan 1965 featuring Cazzie Russell is 1-1, has won their average game by a 81.0 to 71.5 score, and has a rating of 2.5.
 
38Michigan1965Cazzie Russell  11     81  71.5   2.5B10
39Iowa2021  Luka Garza   10      88    69   2.4      B10
40Loyola Marymount (WCC)1990  Bo Kimble   11  119.5    110   2.3     Mid-Maj
41Syracuse2003  Carmelo Anthony   21      76     74   2.3      ACC
42Illinois1989  Nick Anderson   11      78     77    2      B10
43Oklahoma1985  Wayman Tisdale   31    75.3   73.8  1.9      B-12
44Cincinnati2002  Jason Maxiell   22    72.8    71.5  1.9      Amer
45Missouri1982  Steve Stipanovich   20    69.5    65.5  1.5      SEC
46Michigan1989  Glen Rice   02    70.5    78.5  1.3      B10
47Indiana1981   Isaiah Thomas   11      73      73  1.3      B10

Other Set up reminders

When you set up the game, there are adjustment reminders if you plan not to use all players, since each player starts with at least 2 points, 1 foul and 1 rebound that must be given to other players. In this case 1981 Indiana's players have enough stamina that you only need seven players. Since 2 players will not be in the game, I added two points each to Isaiah Thomas (top right), Wittman and Tolbert to start each with 4 points instead of 2 points to give Indiana 20 points at the start of the 20-20 play in the game.

For the 3 rebounds we need to replace, I always work up from the starting center (Turner) so add one rebound to him and then one to Tolbert and Kitchel, the two forwards (we still call the "3" and the "4" the small forward and power forward for easy reference, even though they are often really just bigger guards with modern teams. 

Finally and most important, we need to add three fouls, and try to do it in hopes that the extra foul doesn't make anyone foul out. Obviously I added a foul to two subs, but then picked Wittman for the other extra foul since with only a "36" for fouls on his card - particularly in a home game where a 36 can be turned to a 66 - he is less likely to pick up additional fouls.

The other key in this game is the low dunk ranges and good defensive adjustments to opponents dunk ranges. If you go to the chart in teh game, Iowa is a 51-50, which means they have no automatic dunks, while Indiana calculates as a 51-48, and since that is two below no dunks it actually changes to any 51-52 being a STOP - meaning the shot is missed and defensive player gets the rebound automatically.


The instructions show coins being used to keep track of who is in the game, but another method is just to write the numbers on the team sheet. In this case, Isaiah Thomas and two other starters will play the whole game, so I write 1, 2 and 4 on their cards to show they will be in the whole game, but then 3 and 5 by the two players who will be replaced by a player on the top line. Once I cross those out and write 3 and 5 on the top line I will circle those because they will be in for the rest of the game once inserted.

Also wrote out who gets the ball on the 6, 7 or 8 roll as shown (we suggest using dimes on player getting an extra die roll if you use coins to track who is in the game).


Notice Iowa is much more confusing in their substitutions, with all 10 players being used a lot and noone on the team playing the whole game. Therefore noone is circled, but I also had to play around trying to figure out the possessions each should be in the game and writing in what possessions they would play at what position. One reason I try to play each team a few times is to catch where I have not listed suggestion rotations for a team, so I will likely add the numbers written on these cards back on the master set of cards on the google docs. Also notice that Keegan Murray, who went onto be one of the top players in the country the next year, actually played less than half of games in this season while Luka Garza was National Player of the Year.


Some who play the game have had trouble getting the scoresheet to print out correctly, with the top line being cut off or all 21 images printing from the instructions when they want to just print the scoresheet. I will show these in reverse order, but the image below shows what you hope to see on your printer that will give you a clean print of the whole scoresheet.

The screen below shows how you get to this screen - click on the scoresheet, then right click on it and save the image to your computer. From that point on, you can always pull that image up from your computer to print this image.


Wednesday, December 21, 2022

Annual End of Year Consideration - Please Click

 Sorry our content is often low around the end of year. This is the time I am focused on raising money for my non-profit, Take Back Action Fund.

You know as a reader, we never charge for either of our games - Statis-Pro Baseball and the Value Add Basketball Game - or the player cards we make for either one. We put out annual Statis-Pro Baseball cards and have produced the all-time 60 great teams as well as the all-time international teams. The basketball game includes 135 all-time great college basketball teams from the 1940s through the 2021 Baylor national champs. We also produced the 2020 teams to play off the strike cancelled season, and now have a programmer working on a great tool that we hope can create all teams from the beginning of Ken Pomeroy's pages. Another person developed PDFs to make the Statis-Pro game easier to play.

We hope you enjoy either or both games or other content on these pages as we approach half a million visits.

While this page will always be my unpaid labor of love, if you do make end-of-year contributions to non-profits, we certainly appreciate you clicking here to contribute to fund my day job at Take Back Action Fund. Thank you for your once a year consideration.

Saturday, December 17, 2022

UConn Stopped by Pressure Again with 22 TOs vs Hogs "40 Minutes"

We noted an interesting triangle of games when we first invited the Value Add Basketball Game and were playing just teams from the www.kenpom.com era this century. The UConn 2004 with their dominant size lost by double digits 61-74 vs. the speedy Louisville 2013 team (now 18th in our all-time rankings). However, that UConn team then dominated the Villanova 2018 team (now 5th in our all-time rankings) 73-56. However, Nova then beat Louisville 77-73 to complete the triangle with all three teams going 1-1 against each other. 

Saturday the UConn 1999 team from five years earlier likewise could not handle pressure. Another of the all-time great pressure teams, the 1994 Arkansas "40 minutes of hell" defense, forced 22 UConn turnovers in a lopsided 82-61 win. 

Both superstars had great games, as Arkansas' Corliss Williamson went off for 31 points and 3 blocked shots, and UConn's Richard Hamilton scored 20. Arkansas surges to 15th on our all-time rankings and game log spreadsheet to solidify our Top 25 now that the top 37 teams have all had a chance by playing at least three games against other great teams. The highest ranked team is Cazzie Russell's 1965 Michigan team with a 1-1 mark and ranking 38th out of our 135 all-time great teams in the game.

Another fun note was a 7 year old wanted to roll the dice while I played, with me just telling him the results of the roll. He picked up on things. At one point he said, "are the really low numbers on the 20-sided dice like 1 and 2 when they make 3-point shots?" to which I answered, "unless the defender steals the ball or blocks the shot." Then he asked on another possession "why didn't Arkansas get to try to get a rebound when they missed?" and I showed him that there is only a chance for an offensive rebound on the gray shaded possessions but on the plain white possessions the defense always gets them.

While the UConn 1999 team takes a hit with the loss, the UConn 2004 team rounds out the top 10 - 1, UCLA 1972; 2, Duke 2001; 3, Kansas 2008; 4, Kentucky 1996; 5, Villanova 2018; 6, Kansas 1997; 7, UNC 2005; 8, Indiana 1978; 9, Ohio State 1960; 10, UConn 2004.


Friday, December 9, 2022

World Baseball Championship Standings

West-Far East 

California 1-1 record, 5-3 runs

Asia 1-1 3-5

Texas 0-0

Central America 0-0


North

Puerto Rico 2-0, 8-4 Runs tie-breaker

Pennsylvania 2-0, 10-7

Canada 0-2, 7-10

New York 0-2, 4-8


South

Florida 2-0, 3-1

Cuba 0-0

Venezuela 0-0

Dominican Republic 0-2,.1-3

4.team new pool features all 2nd place and top 3rd place teams.

Same format of round robin double headers, only top team in poll goes to final round.

The winner of that playoff poll goes.to final pool with the three first.place.teams (which had a bye).


Thursday, December 8, 2022

Wednesday, December 7, 2022

Chipper Jones Homer Leads Florida Past the Dominican Republic

 A big double header sweep by Florida against the team the won our "present player" championship - the Dominican Republic. It was the ultimate pitchers' diel for the entire double header with Pedro Martinez and and one of the first two great Dominican MLB players (along with Felipe Aloud) Juan Marichal every but as unhittable as Florida's Jacob deGrom and Steve Carlton.

In World Cup soccer form, we played our first Statis-Pro World Baseball series in 2018 using current players, and the Dominican Republic defeated Venezuela 4 game to 2 in the final championship. The regular season summary showed the Dominican's domination against five other international teams when using current players, while Florida was the #1 seed over #2 California in the 8-team US born division. However, when using the best players from the entire history of MLB, California appears to be the dominant team. 


Monday, December 5, 2022

S. Korean Magic Extends to Baseball & Ohtani Homers Off Seaver


The South Korean magical World Cup soccer run ended against the heavily favored Brazil, but the debut of our Statis-Pro Baseball Classic started with a shocker against heavily favored California.

South Korean Ji-Man Choi homered in the 10th inning to give the the all-time Asian team a 2-0 win against Dennis Eckersley. 

Pool Play and Schedule

This was the debut game in our World Cup style play after finishing the 12 Teams for Statis-Pro Baseball (see this blog) game using the greatest career cards for 19 batters and 18 pitchers for each team.

West/Far East Pool - California (tournament favorite), Asia, Texas, Central America.

Northern Pool - New York, Pennsylvania, Canada and Puerto Rico due to heavy Puerto Rican population in New York.

Southern Pool - Venezuela, Cuba, Dominican Republic, Florida.

Each team goes through 6-man starting pitcher rotation playing each of the three teams in its pool in a double header. If teams are tied for any of the 1st through 4th stats after six games, tie-breakers are broken by "head-to-head" then "fewest runs allowed" then "most runs scored" then "fewest innings at bat" (since a team that doesn't hit in the bottom of the 9th has a disadvantage in runs scored) then if still tied a one-game playoff.

All three second place teams and the highest ranked 3rd place team advance to a second round, from which only the top team advances to the championship round, using the same 6-game record and tie-breakers as above.

The three 1st place teams go straight from the 1st round to await the winner of the second round - and once again all teams play each other in double headers to determine the champion. However, if tied for 1st the teams play a 3-game championship series.

California is the favorite because they feature 20 Hall of Famers on their roster -  they are so deep that Tony Gwynn pinch hit in both games - and Asia features none. However Japan's Ichiro and perhaps the best player in the game today - Shohei Ohtani - will be in the Hall of Fame once eligible. 

Ohtani pitched 6 scoreless innings against a line-up that includes 3, 4 and 5 hitters Barry Bonds, Ted Williams and Joe DiMaggio.

Williams and fellow Hall of Famer Joe Gordon hit DEEP drives to the wall that were caught.

Ichiro singled twice and stole second both times, but Randy Johnson threw 2-hit ball for 7 innings before Eckersley came in as the one closer who could go up to 4 innings.

In the second game Tom Seaver won to give California the split, allowing only a homer to Ohtani in a 5-1 win. Max Fried, Dan Quisenberry and Trevor Hoffman pitched the last three innings - while Hideo Nomo pitched the final inning for Asia.

The split is a huge win for Asia, as a sweep over Mexico would guarantee them at least a 3-3 mark in poll play and good shot at advancing.

Here is the 10 inning 2-0 upset win by Asia, followed by the 5-1 win from California to split the first series.


UConn 1999 vs. Arkansas 1994 for Last All-Time Top 25 Spot

We rescheduled a few games on our Value Add Basketball Game game log in order to continue to get top teams up to at least three games played.

#24 Arkansas 1994 will now play #31 UConn 1999 as the two highest ranked teams without three games played.

The two teams that were scheduled to play those two teams will now play each other for a super matchup of big men, Shaq's LSU team against Bill Russell's San Francisco team.

UConn will still need one more game played after that to hit three games, so they will play the next highest ranked team with fewer than three games played - #39 Michigan 1965.

After those we will get up to three games played through the top 44 teams with #40 Iowa 2021 plays both #43 Illinois 1943 and then the highest scoring team ever, #41 Loyola Marymount, who is 1-1 averaging 120 points scored and 110 points allowed both games.

Pages 6 and 17 provide the cards for the biggest left Arkansas vs. UConn game.


Statis-Pro Baseball Batters Cards to Complete Teams for Countries and States

The Statis-Pro World Baseball Classic teams are now ready to play, with the 12 line-ups and reserves on this google sheet and below in this blog.

The corresponding teams' pitchers were posted here, with this google sheet.

The batters cards for when those pitchers bat was posted here, and on this google sheet.

If you print out those player cards for any of the 12 teams you want to play against each other, then pull up this free Statis-Pro Baseball Game rules for the rest of what you need for a game.

While the game can be played as is, there will be additions. Currently all fielders have "average" fielding ratings, and batters are simply listed as switch hitters because we have not listed which are right- or left-handed, just as we have not added whether each pitcher throws left or right. The pitchers are shown as "SP" (power-hitting switch hitter) or "SN" (normal switch-hitting) so that when we update for who hits right or left, we already note if they were calculated as a power hitter or not.

While every player has three DEEP numbers that can fly out of the park in modern games or be caught in a dead ball era game - the only player in the league to also have 7 home run numbers is Fernando Tatis Jr. Unlike the All-Time 60 great teams, these stats are based on a players entire career, not just one big season. Therefore even Barry Bonds does not have the home run range Tatis has because for many years he was a base stealing star without huge power.

Our two regional teams each include players from three countries:

The Asian team is almost all Japanese players, except for Chien-Ming Wang from Taiwan and eight players from South Korea; Shin-Soo Choo, Ha-Seong Kim, Jung Ho Kang, Ji-Man Choi, Hyun Jin Ryu. Chan Ho Park and Byung-Hyun Kim.

The Central American team is pretty evenly split between players from Panama, including Rod Carew and Mexican players, in addition to a couple from Nicaragua.


Click for the free Statis-Pro Master Baseball Game. Click here for 60 of the all-time great MLB teams, or on teams of many of the all-time great players on teams by nation or state with one sheet for each team. Or click on the 2023 pitchers and 2023 batters in card form. You simply print two teams cards and then either print the master link above and fast action cards in master link or buy the dice to start playing.


Sunday, December 4, 2022

Greatest 18 Pitchers from 12 Countries or States

We already posted the batting cards for pitchers for our new World Baseball Classic Statis-Pro Baseball Cards, and here are their actual pitching cards. They also appear on this google sheet, and I will see if the reader who put together the great PDFs can do the same with these. We still need to create the batter sheets for the same teams.

I selected the top 6 starting pitchers and those are in blue at the beginning of each team. If my first game is Asia vs. California, then I would start Shohei Ohtani against Randy Johnson. If you scroll across you will notice that I have not filled in whether a pitcher is left-handed or righthanded, and for now I also just made everyone an average fielder.

The biggest factor in determining a pitchers PB rating is his career ERA divided by the average ERA in his middle nine seasons. The only pitcher in the game whose ERA was less than half the MLB average is Mariano Rivera. Also the changes in eras do yield different ranges due to types of play. For example, even Nolan Ryan's incredible strikeout records at the time yield an 18-42 strikeout range - amazing at the time but actually just above average in today's game of strikeouts and home runs. However, only allowing hits on 11-16 puts the all-time no hitter champion in a spot to do it anytime he is hot.

I went with 6 starting pitchers so that if I play in my four team divisions, each team can play the other three in a double header and have each starter pitch in one of those games. The pitchers in black font are then the middle relievers in order of best to worst, and then the three pitchers in red are the closers to use in late innings. Obviously you can use any pitcher in your games, but I want to set them up on a logical order to make it easier to choose.


Duke 2001 On Verge of Replacing UCLA 1972 as All-Time #1 After Thrashing UNLV

 In what looked like a very event match-up of heavyweights, Carlos Boozer drew the 4th foul on Larry Johnson with 17:28 to play and completed a 3-point play to make it 45-30 Duke. Johnson (18 points, 10 rebounds) survived the rest of the game, but had to guard the jump shooter Mike Dunleavy the rest of the game to avoid the 5th foul.

Duke crashed the offensive boards, with all four starters (not point guard Jay Williams) getting seven or more rebounds for a dominant 42-26 edge on the boards.

Shane Battier (26 points, 9 rebounds) hit three 3-pointers early, and Boozer (24, game-high 12 rebounds) led such a dominant 78-65 win that Duke's all-time rating in our game improved to 15.4, passing Kentucky and Kansas teams and coming within 0.1 of catching bill Walton's UCLA as the top team of all time. The scoresheet from the game is at the bottom of this blog, after the updated all-time Top 25 and teams that could make the list soon.

Click on the game to play yourself - it contains everything you need to play the Value Add Basketball game, which lets you pit any of 136 great all-time college teams against each other. To pick your two teams it is best to click on this Google doc and print the pages of the teams you want (each team is one page). I track my games on this google sheet, but play your own for free!
 
All-TimeTeamYearPlayerWonLostScoreAllowRatingConf
1UCLA1972Bill Walton60726215.5Pac-12
2Duke2001Shane Battier3082.37115.4ACC
3Kansas2008Mario Chalmers5174.75615.2B-12
4Kentucky1996Antoine Walker217269.313.6SEC
5Villanova2018Mikal Bridges7279.470.310.8BEast
6Kansas1997Paul Pierce3075.360.310.1B-12
7North Carolina2005Sean May3272.264.49.6ACC
8Indiana1976Scott May3171.359.89.6B10
9Ohio St.1960Jerry Lucas218476.38.9B10
10Connecticut2004Ben Gordon5273.5648.8BEast
11Gonzaga (WCC)2017Nigel Williams-Goss3369.8638.7Mid-Maj
12Houston1968Elvin Hayes317363.88.5Amer
13Virginia2019Kyle Guy4172.665.48.3ACC
14Duke2010Jon Scheyer527466.77.9ACC
15Michigan St.2000Mateen Cleaves3088.378.37.3B10
16Baylor2021Jared Butler228678.57.1B-12
17Louisville2013Russ Smith217466.37ACC
18North Carolina1982Michael Jordan5168.8656.7ACC
19Duke1992Christian Laettner1271.564.56.6ACC
20Cincinnati1960Oscar Robertson1274786.2Amer
21UCLA1967Kareem Abdul-Jabbar2183875.6Pac-12
22DePaul1980Mark Aguirre3080.367.75.6BEast
23UNLV (MWC)1991Larry Johnson1272.776.35.4Mid-Maj
24Arkansas1994Corliss Williamson0272755.3SEC
25North Carolina St.1974David Thompson217272.75.1ACC

Arkansas is the only top 25 team that has not played three games yet. If they lose, Carsen Edwards 2018 Purdue team should slide into #25. However, Richard Hamilton's UConn is #31 but has only played one game, so could easily be ranked with two good showings. 

We were planning on Arkansas playing Shaq's LSU next for an all-SEC showing, but may change to a UConn vs. Arkansas match-up to see if Arkansas can prove they belong or if UConn wins to get close or in - then have them play their third game. Once UConn and Arkansas have played three games each, all 38 current top teams will have played at least three games.

If you add 21 to the rating you would have a rough equivalent to an SRS or KenPom ratings so we'd expect UCLA or Duke to beat an average team by about 36 points, but beat an "average great team" in this game by 15.


Final All-time Top 25 Match-up - UNLV vs. Duke

While the initial great teams from the www.kenpom.com era (2002 - present) played a number of games, we are working through match-ups to make sure all of our teams have played at least three games  After this All-Time Top 25 match-up all of our Top 25 teams will have played at least three games against other all-time great Value Add Basketball Game teams.


#16 UNLV 1991. Larry Johnson's dominant UNLV team was upset 71-70 by the historic Texas Western Team (Now UTEP, first all-black team to win the national title) to drop after beating the UCLA 2006 team. This was the team that won 44 straight games including a 30-point national title win against Duke before losing a thriller rematch against Duke to end the streak.

#4 All-Time Duke 2001. Shane Battier's Duke, which already handled the 1971 Marquette and 2021 Baylor teams by double digits could move into the top three with a win. The Duke team that upset UNLV actually won the title again in 1992, and the next Duke team to win the title was this 2001 team.


Pitchers at Bat for World Baseball Classic Statis-Pro Baseball Game

The following are the sheets for when a pitcher is at bat in our all-time World Baseball Classic Statis-Pro Game. I plan to make this available in a pdf form like the all-time great MLB teams, but for now I do at least have it on this google doc if you find that easier to print than the images below. They are divided into six images - 2 teams to a page for the 12 total teams.

Not counting Ohtani - who normally hits as a DH - or players like Marylander Babe Ruth who were born in places that do not have a team in may game, the following are the greatest hitting pitchers in our game - while Hall of Famer Hilton Smith from the 30s and 40s nudging out the more recent "Big Z" Carlos Zambrano.

Rnk, Great Hitting Pitcher, HR Range, Born in, MLB Years

1, Hilton Smith HOF, Home Run on 32, Texas, 1932-1948

2, Carlos Zambrano, Home Run on 25-26, Venezuela, 2001-2012

3. CC Sabathia, Home Run on 25-26, California, 2001-2019

4, Bob Lemon HOF, Home Run on 22-23, California, 1941-1958

5, Yovani Gallardo, Home Run on 23-24, Central America, 2007-2018

6, Bucky Walters, Home Run on 26, Pennsylvania, 1931-1950

7, Omar Olivares, Home Run on 25, Puerto Rico, 1990-2001

8, Rick Rhoden, Home Run on 26, Florida, 1974-1989

9, German Marquez, Home Run on 26, Venezuela, 2016-2022

10 (tie), Mike Hampton, Home Run on 25, Florida, 1993-2010 and Zack Greinke, Home Run on 24, Florida, 2004-2022

Keep in mind Zambrano, Sabathia, Lemon and Gallardo's two home run numbers on their cards are the equivalent of four home runs on a batters card, since the action is on the pitchers batting card every at bat - vs. just half the time for a normal batter. Therefore those four are legimate power hitting pitchers.

The one difference in pitcher at bat cards in this came is that you skip the PB (2-12) of the opposing pitcher and go directly to the RN number (11-88) and find it on the row below of the pitcher who is hitting. The number represents the end of each range, so if Yu Darvish is batting, the 14 indicates 11-14 is a single, 15-16 is a double, 17 is a deep drive (which has a 1 in 3 chance of being a homer or otherwise is caught for a sac fly), an 18-51 is a strikeout, a 52 is a walk, and a 53-88 is an out.

Each team - representing a country, group of three countries or a state - has 18 all-time pitchers and 19 batters. We will still need to create the batters cards and pitchers cards, but we listed who the players are in previous blogs. 


Saturday, December 3, 2022

SEC - Kentucky "Untouchables" 71, Arkansas "40 Minutes of Hell" 66

 Game Results from Arkansas 1994 vs. Kentucky 1996 to follow:

One more on the two opening lineups in the photo in the bottom - I wrote in who got the ball on which dice roll with the backups who start the game. Notice at the opening both teams had only two players with an extra number so on an 8 for either team with this lineup, noone gets a shot off, the dice are rolled on more time, and on the second roll a roll of 6-8 is a turnover. This only lasts for possessions 44 to 41 for Arkansas, because Scotty Thurman comes in the with a 3&7, so at that point Alex Dillard is a 1&6, and Darnell Robinson is a 5&8 (started game as 5&7). The 6, 7 and 8 are interchangable, they just mean that player gets the ball on one extra number on the 8-sided die roll.

Also, the teams actual dunk ranges for the game rallied 68 and 66. As long as Arkansas is 2 higher than Kentucky for the game you can set dunk ranges wherever you want, so we made Arkansas 51-63 and Kentucky 51-61.

Game Result: Kentucky led several times by 9 points, as Antoine Walker held super start Corliss Williamson in check despite one of the best cards in the game. Williamson gets the ball on a 4, 7 or 8 on the 8-sided die roll, and then either scores or is fouled on 1-14 on the 20-sided die. Despite him only having 6 points with 4:35 (8 possessions) to play, Arkansas managed to tie the score 58-58.

And then he went to work - scoring on 3 straight possessions to double his total to 12 points with 2:44 (5 possessions) to play. However, two of those three times Tony Delk responded with 3-pointers to keep the score 64-64.

Walker and Pope then scored to make it 64-68 Kentucky with 1:30 (3 possessions) to play. 

Then we had an interesting strategy decision. Point Guard Corey Beck got the ball (1 on 8-sided die) and had a 53 meaning he could "dunk" - however he also drew an 8 on the 20-sided die that results in one of his incredible foul drawn ability (7-13 on the 20-sided die, or 30% of the 20-sided die rolls). When a player is in the dunk range he has the option of taking the 20-sided result, and the argument for doing so is that a foul or steal and fast break for a team in the last five minutes (9 possessions) creates an extra possession on the bottom half of the diagonal.

With only 2 possessions left, he could take the 2-point basket made to assure the score was 66-68 on the top part of the 2 possession, 0:53 seconds remaining, but that would mean Kentucky likely still had 2 possessions left and Arkansas only 1 unless they fouled or got a steal and fastbreak (guards can always fast break off a steal, but forwards only can on an odd number roll of 11, 13 or 15 and centers can never start a fast break on a steal). 

The downside was Beck is only a 65% free throw shooter (1-13 on 20-sided die is made) so misses could leave them still 3 or 4 behind. We opted to take the foul drawn, and Beck did hit both free throws to make it 66-68 with more time left.  However, Walter McCarty hit a 3-pointers and Arkansas could not score on their final two possessions to fall short.

Kentucky stayed in 3rd in our all-time rankings, just ahead of Shane Battier's 2001 Duke team, while Arkansas moved into the all-time Top 25 with the impressive showing to follow-up on a 78-79 loss to Auburn's 2019 team. At 0-2 they will face Shaq's LSU team coming off a victory over Marquette. Kentucky did lose a narrow game to Tim Duncan's Wake Forest team before beating the 2017 Gonzaga team. The rankings are similar to www.kenpom.com, with teams starting with the equivalent of 4 games based on how good their cards and SRS was, then adjusting for every game based on the opponent's ranking and the spread. However, we give an extra 5 points for the team that wins the game in the calculation.

The game log and updated rankings are kept on this google sheet. The top 25 is also listed at the bottom of the blog.


Background on Game

After Georgia won the SEC football title today, and I personally went to a great overtime basketball game between Jim Chones Marquette and Shaq's LSU, we turned to SEC basketball in our Value Add Basketball Game.

Clicking on the Value Add Basketball Game link and then the google doc of teams, we printed pages 6 and 57 to get a match-up of the Arkansas "40 Minutes of Hell" team that took the 1994 title from Duke, then the Kentucky 1996 that is currently ranked as our No. 3 team of all time. We are trying to get every team up to three games to see who is legit - so that provided a top 40 all-time match-up for Kentucky to show if they could beat the press and contend for No. 1.


Here is the updated Top 25. The biggest surprise to some may be the 1980 DePaul team that was stunned in the second round and then first round in back-to-back years despite being a No. 1 seed - which still haunts DePaul fans.

All-TimeTeamYearPlayerWonLostScoreAllowRatingConf
1UCLA1972Bill Walton60726215.5Pac-12
2Kansas2008Mario Chalmers5174.75615.2B-12
3Kentucky1996Antoine Walker217269.313.6SEC
4Duke2001Shane Battier2084.57412.8ACC
5Villanova2018Mikal Bridges7279.470.310.8BEast
6Kansas1997Paul Pierce3075.360.310.1B-12
7North Carolina2005Sean May3272.264.49.6ACC
8Indiana1976Scott May3171.359.89.6B10
9Ohio St.1960Jerry Lucas218476.38.9B10
10Connecticut2004Ben Gordon5273.5648.8BEast
11Gonzaga (WCC)2017Nigel Williams-Goss3369.8638.7Mid-Maj
12Houston1968Elvin Hayes317363.88.5Amer
13Virginia2019Kyle Guy4172.665.48.3ACC
14Duke2010Jon Scheyer527466.77.9ACC
15Michigan St.2000Mateen Cleaves3088.378.37.3B10
16UNLV (MWC)1991Larry Johnson1176.575.57.3Mid-Maj
17Baylor2021Jared Butler228678.57.1B-12
18Louisville2013Russ Smith217466.37ACC
19North Carolina1982Michael Jordan5168.8656.7ACC
20Duke1992Christian Laettner1271.564.56.6ACC
21Cincinnati1960Oscar Robertson1274786.2Amer
22UCLA1967Kareem Abdul-Jabbar2183875.6Pac-12
23DePaul1980Mark Aguirre3080.367.75.6BEast
24Arkansas1994Corliss Williamson0272755.3SEC
25North Carolina St.1974David Thompson217272.75.1ACC

Line-ups and Reserves for Statis-Pro World Baseball Classic

The following are the starting line-ups and reserves we chose for our Statis-Pro Baseball All-Time World Baseball Classic Game. The cards are not yet made.

Each team had a starting line-up - and we plan to make pitchers hit to allow more of the reserves to pinch hit - then 11 reserves. The reserves must include two extra catchers and two extra outfielders, and then one extra player at every other position. That leaves three extra positions that can come from any position.

The three divisions I will plan to use when I get around to creating these cards and playing them:

Group 1 - Venezuela, Dominican Republic, Cuba and Florida. Those 4 line up nicely and Miami being the largest Cuban population would make that logical (Southern division).

Group 2 - While Puerto Rico is obviously close to all of Group 1, the fact that New York has the largest Puerto Rican population makes it most logical for Puerto Rico to be flying to our Northern Division to play New York, Canada and Pennsylvania.

Group 3 - the Western Division is also logical, though obviously thousands of miles from Mexico to Japan. Still, with California and Texas in between those two that will be our final division.

The startign line-up is listed in order, then the reserves are listed in alphabetical order.

The one that is a little confusing is Asia. We are listing batting for all teams with the pitchers hitting 9th in each game. However, we are playing DHs including Shohei Ohtani at 1st base when they would DH. Ohtani always bats 2nd in the line-up. If he is not the pitcher, then he plays first base and therefore Ji-Man Choi plays 1st base and bats 9th since the pitcher is the No. 2 spot. However, if Ohtani is not the starting pitcher, then he simply plays 1st base on the No. 9 batter is the pitcher, with Choi moving to the bench.
 
0AsiaPosYearsBAOPSHRSpeedwar-yr
1Ichiro Suzuki7-OF2001-20190.3110.757117A3.2
2Shohei Ohtani3-1B2018-20220.2670.886127C5
3Shin-Soo Choo7-OF2005-20200.2750.824218C2.2
4Tadahito Iguchi4-2B2005-20080.2680.73944C1.6
5Hideki Matsui7-OF2003-20120.2820.822175D2.1
6Jung Ho Kang5-3B2015-20190.2540.79646D1.5
7Hee-Seop Choi2-C2002-20050.240.78640D0.7
8Ha-Seong Kim6-SS2021-20220.2350.67919C3.6
9Ji-Man Choi (if Ohtani P)3-1B2016-20220.2390.77361D0.7
 Nori Aoki7-OF2012-20170.2850.73833B1.7
 Kenji Johjima2-C2006-20090.2680.72148D1.3
 Kosuke Fukudome7-OF2008-20120.2580.75442D0.9
 Kazuo Matsui4-2B2004-20100.2670.70132A0.8
 Keith McDonald2-C2000-20010.3331.7883E0.1
 Norihiro Nakamura5-3B2005-20050.1280.3500E-0.8
 Tsuyoshi Nishioka6-SS2011-20120.2150.5030D-1.2
 Dave Roberts7-OF1999-20080.2660.70823AA0.9
 Tsuyoshi Shinjo7-OF2001-20030.2450.66820D1.3
 Seiya Suzuki7-OF2022-20220.2620.77014C2
0CaliforniaPosYearsBAOPSHRSpeedwar-yr
1Alan Trammell (HOF)6-SS1977-19960.2850.767185C3.5
2Joe Gordon (HOF)4-2B1938-19500.2680.822253D5.1
3Barry Bonds7-OF1986-20070.2981.051762A7.4
4Ted Williams (HOF)7-OF1939-19600.3441.116521D6.4
5Joe DiMaggio (HOF)7-OF1936-19510.3250.977361D6.1
6Eddie Murray (HOF)3-1B1977-19970.2870.836504D3.3
7Gary Carter (HOF)2-C1974-19920.2620.773324D3.7
8Graig Nettles5-3B1967-19880.2480.750390D3.1
 Bobby Bonds7-OF1968-19810.2680.824332A4.1
 Frank Chance (HOF)3-1B1898-19140.2960.78820AA2.7
 Joe Cronin (HOF)6-SS1926-19450.3010.857170D3.2
 Bobby Doerr (HOF)4-2B1937-19510.2880.823223D3.7
 Darrell Evans5-3B1969-19890.2480.792414D2.8
 Nomar Garciaparra6-SS1996-20090.3130.882229C3.2
 Tony Gwynn (HOF)7-OF1982-20010.3380.847135B3.5
 Harry Heilmann (HOF)7-OF1914-19320.3420.930183D4.3
 Jason Kendall2-C1996-20100.2880.74475C2.8
 Ernie Lombardi (HOF)2-C1931-19470.3060.818190D2.2
 Duke Snider (HOF)7-OF1947-19640.2950.919407D3.7
0Central AmericaPosYearsBAOPSHRSpeedwar-yr
1Rod Carew (HOF)3-1B1967-19850.3280.82292B4.3
2Roberto Kelly7-OF1987-20000.290.767124A1.5
3Frankie Austin6-SS1944-19480.3430.8443C2
4Bobby Avila4-2B1949-19590.2810.74780D2.6
5Manny Sanguillen2-C1967-19800.2960.72465D2.1
6Carlos Lee7-OF1999-20120.2850.821358D2
7Ben Oglivie7-OF1971-19860.2730.786235D1.6
8Vinny Castilla5-3B1991-20060.2760.797320D1.2
 Everth Cabrera6-SS2009-20150.2460.64312AA0.8
 Erubiel Durazo3-1B1999-20050.2810.86894D1.3
 Alejandro Kirk2-C2020-20220.2780.78823E1.7
 Hector Lopez7-OF1955-19660.2690.745136D1.1
 Omar Moreno7-OF1975-19860.2520.64937AAA0.8
 Jorge Orta4-2B1972-19870.2780.746130D0.9
 Adolfo Phillips7-OF1964-19720.2470.75359B1.7
 Aurelio Rodriguez5-3B1967-19830.2370.626124D0.9
 Carlos Ruiz2-C2006-20170.2640.74271D1.9
 Rennie Stennett4-2B1971-19810.2740.66541C1.3
 Alex Trevino2-C1978-19900.2490.64323D0.6
0CubaPosYearsBAOPSHRSpeedwar-yr
1Cristóbal Torriente (HOF)7-OF1920-19320.340.95155B2.6
2Minnie Minoso (HOF)7-OF1946-19800.2990.848195C2.7
3Tony Oliva (HOF)7-OF1962-19760.3040.830220D2.9
4Martín Dihigo (HOF)2-C1923-19450.3070.91868C2.5
5Tony Perez (HOF)3-1B1964-19860.2790.804379D2.3
6Yoan Moncada5-3B2016-20220.2530.75982D1.9
7Tony Taylor4-2B1958-19760.2610.67375C1.2
8Bert Campaneris6-SS1964-19830.2590.65379AA2.8
 José Abreu5-3B2014-20220.2920.860243D3.5
 Yordan Alvarez7-OF2019-20220.2960.97398D3.4
 Jose Canseco3-1B1985-20010.2660.867462C2.5
 Leo Cardenas6-SS1960-19750.2570.679118D1.7
 Yoenis Céspedes7-OF2012-20200.2730.824165D2.7
 Yunel Escobar2-C2007-20170.2820.73690D2.4
 Tito Fuentes4-2B1965-19780.2680.65345D0.9
 Tony Gonzalez7-OF1960-19710.2860.764103D2.3
 Yasmani Grandal2-C2012-20220.2370.785177D1.8
 Rafael Palmeiro3-1B1986-20050.2880.885569D3.6
 Yasiel Puig7-OF2013-20190.2770.823132C2.7
0Dominican RepublicPosYearsBAOPSHRSpeedwar-yr
1Fernando Tatis Jr.6-SS2019-20210.2920.96581A4.5
2Jose Ramirez5-3B2013-20220.2790.857192B4
3Vladimir Guerrero (HOF)7-OF1996-20110.3180.931449C3.7
4Manny Ramirez7-OF1993-20110.3120.996555D3.6
5Sammy Sosa7-OF1989-20070.2730.878609C3.3
6David Ortiz (HOF)3-1B1997-20160.2860.931541D2.8
7Robinson Canó4-2B2005-20220.3010.839335D4
8Tony Pena2-C1980-19970.260.673107D1.4
 Felipe Alou7-OF1958-19740.2860.761206D2.5
 Adrian Beltre5-3B1998-20180.2860.819477D4.5
 Welington Castillo2-C2010-20190.2540.73898D1.2
 Cesar Cedeno7-OF1970-19860.2850.790199AA3.1
 Tony Fernandez6-SS1983-20010.2880.74694C2.7
 Rafael Furcal6-SS2000-20140.2810.748113A2.8
 Placido Polanco4-2B1998-20130.2970.740104D2.6
 Albert Pujols3-1B2001-20220.2960.918703D4.6
 Carlos Santana2-C2010-20220.2420.791278D2.5
 Juan Soto7-OF2018-20220.2870.950125D4.6
 Miguel Tejada6-SS1997-20130.2850.791307D2.9
0FloridaPosYearsBAOPSHRSpeedwar-yr
1Tim Raines (HOF)7-OF1979-20020.2940.810170AA3
2Trea Turner6-SS2015-20220.3020.842124AA3.7
3Chipper Jones (HOF)5-3B1993-20120.3030.930468D4.5
4Anthony Rizzo3-1B2011-20220.2650.847283D3.3
5Robby Thompson4-2B1986-19960.2570.733119C3.1
6Andre Dawson (HOF)7-OF1976-19960.2790.806438C3.1
7Gary Sheffield7-OF1988-20090.2920.907509C2.8
8Al Lopez (HOF)2-C1928-19470.2610.66351D0.9
 Bo Bichette6-SS2019-20220.2970.83169C3.2
 Luis Gonzalez7-OF1990-20080.2830.845354D2.7
 Charles Johnson2-C1994-20050.2450.762167D1.9
 John Henry Lloyd (HOF)4-2B1921-19290.3490.86516B1.8
 Manny Machado5-3B2012-20220.2820.833283D4.7
 Andrew McCutchen7-OF2009-20220.2770.838287C3.4
 Fred McGriff3-1B1986-20040.2840.886493D2.8
 Boog Powell3-1B1961-19770.2660.822339D2.3
 Mickey Rivers7-OF1970-19840.2950.72461A2.2
 Mike Stanley2-C1986-20000.270.827187D1.4
 Kyle Tucker7-OF2018-20220.2680.83773B2.6
 Bill White3-1B1956-19690.2860.806202D3
0New YorkPosYearsBAOPSHRSpeedwar-yr
1Eddie Collins (HOF)4-2B1906-19300.3330.85347AA5
2Lou Gehrig (HOF)3-1B1923-19390.341.080493D6.7
3Alex Rodriguez6-SS1994-20160.2950.930696C5.3
4Carl Yastrzemski (HOF)7-OF1961-19830.2850.841452D4.2
5Jimmy Collins (HOF)5-3B1895-19080.2940.75265C3.8
6Willie Keeler (HOF)7-OF1892-19100.3410.80233A2.9
7B.J. Surhoff7-OF1987-20050.2820.745188D1.8
8Craig Biggio (HOF)2-C1988-20070.2810.796291B3.3
 Rocky Colavito7-OF1955-19680.2660.848374D3.2
 George Davis (HOF)6-SS1890-19090.2950.76773AA4.2
 Johnny Evers (HOF)4-2B1902-19290.270.69012A2.6
 Hank Greenberg (HOF)3-1B1930-19470.3131.017331D4.3
 John McGraw (HOF)5-3B1891-19070.3340.87613AAA2.7
 A.J. Pierzynski2-C1998-20160.280.739188D1.3
 Phil Rizzuto (HOF)6-SS1941-19560.2730.70638C3.2
 Wally Schang2-C1913-19310.2840.79459C2.5
 Ken Singleton7-OF1970-19840.2820.824246D2.8
 Andy Van Slyke7-OF1983-19950.2740.792164B3.2
 Lou Whitaker4-2B1977-19950.2760.789244D4
0PennsylvaniaPosYearsBAOPSHRSpeedwar-yr
1Honus Wagner (HOF)6-SS1897-19170.3280.858101AA6.2
2Ken Griffey Jr. (HOF)7-OF1989-20100.2840.907630C3.8
3Stan Musial (HOF)3-1B1941-19630.3310.976475D5.8
4Reggie Jackson (HOF)7-OF1967-19870.2620.846563C3.5
5Buddy Bell5-3B1972-19890.2790.747201D3.7
6Hack Wilson (HOF)7-OF1923-19340.3070.940244D3.2
7Roy Campanella (HOF)2-C1937-19570.2830.861259D2.3
8Nellie Fox (HOF)4-2B1947-19650.2880.71035D2.6
 Dick Allen3-1B1963-19770.2920.912351C3.9
 Max Bishop4-2B1924-19350.2710.78941D3.2
 Jack Clark7-OF1975-19920.2670.854340D2.9
 Ken Griffey7-OF1973-19910.2960.790152C1.8
 Whitey Kurowski5-3B1941-19490.2860.821106D2.7
 Sherry Magee7-OF1904-19190.2910.79083A3.7
 Lance Parrish2-C1977-19950.2520.753324D2.1
 Mike Piazza (HOF)2-C1992-20070.3080.922427D3.7
 Eddie Stanky4-2B1943-19530.2680.75829D3.8
 Gene Tenace2-C1969-19830.2410.817201D3.1
 Bobby Wallace (HOF)6-SS1894-19180.2680.69034C3.1
0Puerto RicoPosYearsBAOPSHRSpeedwar-yr
1Roberto Alomar (HOF)4-2B1988-20040.30.814210A3.9
2Jose Cruz7-OF1970-19880.2840.774165B2.9
3Roberto Clemente (HOF)7-OF1955-19720.3170.834240D5.3
4Orlando Cepeda (HOF)3-1B1958-19740.2970.849379C2.9
5Francisco Lindor6-SS2015-20220.2770.816184C4.6
6Carlos Beltran7-OF1998-20170.2790.837435C3.5
7Ivan Rodriguez (HOF)2-C1991-20110.2960.798311D3.3
8Mike Lowell5-3B1998-20100.2790.805223D1.9
 Carlos Baerga4-2B1990-20050.2910.754134D1.4
 Javier Baez6-SS2014-20220.260.766166C2.9
 Carlos Correa6-SS2015-20220.2790.836155D4.9
 Carlos Delgado3-1B1993-20090.280.929473D2.6
 Leo Gomez5-3B1990-19960.2430.75379D1.4
 Juan Gonzalez7-OF1989-20050.2950.904434D2.3
 Sixto Lezcano7-OF1974-19850.2710.799148D2.4
 Yadier Molina2-C2004-20220.2770.726176D2.2
 Jorge Posada2-C1995-20110.2730.848275D2.5
 Ruben Sierra7-OF1986-20060.2680.765306C0.8
 Bernie Williams7-OF1991-20060.2970.858287C3.1
0TexasPosYearsBAOPSHRSpeedwar-yr
1Joe Morgan (HOF)4-2B1963-19840.2710.819268AA4.6
2Tris Speaker (HOF)7-OF1907-19280.3450.928117B6.1
3Eddie Mathews (HOF)5-3B1952-19680.2710.885512D5.7
4Frank Robinson (HOF)7-OF1956-19760.2940.926586C5.1
5Trevor Story6-SS2016-20220.2680.849174B4.2
6Ernie Banks (HOF)3-1B1953-19710.2740.830512D3.6
7Ross Youngs (HOF)7-OF1917-19260.3220.83942C3.3
8Biz Mackey (HOF)2-C1920-19470.3280.85952C1.2
 Lance Berkman3-1B1999-20130.2930.943366D3.5
 Don Buford7-OF1963-19720.2640.74193B3.6
 Norm Cash3-1B1958-19740.2710.862377D3.1
 Cecil Cooper3-1B1971-19870.2980.803241D2.1
 Curt Flood7-OF1956-19710.2930.73285D2.8
 Mike Hargrove3-1B1974-19850.290.78780D2.5
 Rogers Hornsby (HOF)4-2B1915-19370.3581.010301D5.5
 Anthony Rendon5-3B2013-20220.2850.847156D3.3
 Garry Templeton6-SS1976-19910.2710.67370C1.7
0VenezuelaPosYearsBAOPSHRSpeedwar-yr
1Ronald Acuna Jr.7-OF2018-20220.2770.887120A3.5
2Jose Altuve4-2B2011-20220.3070.830192A3.9
3Luis Aparicio (HOF)6-SS1956-19730.2620.65383A3.1
4Bobby Abreu7-OF1996-20140.2910.870288A3.3
5Miguel Cabrera3-1B2003-20220.3080.908507D3.4
6Salvador Perez2-C2011-20220.2680.764223D2.9
7Magglio Ordonez7-OF1997-20110.3090.871294D2.6
8Edgardo Alfonzo5-3B1995-20060.2840.782146D2.4
 Dave Concepcion6-SS1970-19880.2670.679101B2.1
 Willson Contreras2-C2016-20220.2560.808117D3
 Andres Galarraga3-1B1985-20040.2880.846399D1.7
 Carlos Gonzalez7-OF2008-20190.2850.843234C2
 Ramon Hernandez2-C1999-20130.2630.744169D1.5
 Omar Infante4-2B2002-20160.2710.69582D1.1
 Victor Martinez3-1B2002-20180.2950.815246D2
 Melvin Mora5-3B1999-20110.2770.781171D2.2
 Eugenio Suarez5-3B2014-20220.250.799224D2
 Cesar Tovar7-OF1965-19760.2780.70346B2.4
 Omar Vizquel6-SS1989-20120.2720.68880B1.9