Friday, September 29, 2023

DBacks Statis-Pro Pitching Crushed Again - GIants May Flip and Make Playoffs

While the Giants were eliminated from the actual MLB playoffs recently and the Diamondbacks are clinging to a half game lead for a wild card - in Statis-Pro the Dbacks pitching is so bad the teams may reverse. 

Until Friday the teams lined up the same as MLB with Arizona in and San Francisco out, but as the scoresheets below show, the Giants destroyed the very weak Arizona pitching staff for wins of 6-4 and 15-4, the second of which counted as a sweep thus recording the series as five games to one.

.That puts the Giants in the wild card spot right now, two games ahead of the last spot, while Arizona drops one game below.

The Phillies and Marlins are tied for the last spot and both are actually in the playoffs right now in MLB, though the Phillies have clinched and Marlins still need to win. 

The Cubs and Reds are 1 1/2 games out in real MLB and trying to sneak in at the end, and while that is about the same spot Cincinnati is in for Statis-Pro, but in Statis-Pro the Cubs are in.

The top three teams are the same in both, except the Dodgers are first in Statis-Pro and the Braves in the actual MLB season. Here are the Statis-Pro standings.

Tm           Wins     Losses     W%          GB Last PO Spot
LAD36180.6679
Atl38220.6338
Mil33270.5503
SF32280.5332
ChC34320.5151
Mia30300.5000
Phi30300.5000
AZ29310.483-1
Cin27330.450-3

Click for the free Statis-Pro Master Baseball Game. Click here for 60 of the all-time great MLB teams, or on teams of many of the all-time great players on teams by nation or state with one sheet for each team. Or click on the 2023 pitchers and 2023 batters in card form. You simply print two teams cards and then either print theaster link above and fast action cards in master link or buy the dice to start playing. 


Thursday, September 28, 2023

AL Statis-Pro Season Complete - Playoffs Set

While the NL Statis-pro season has inexcusable not been completed due to the Milwaukee based commissioner getting sidetracked with an off season breakthrough in his basketball season - the AL is done and ready for the playoffs.

In fact, kudos to the Montana-based commissioner for setting a record for games played. His records are actually games played. The Milwaukee commissioners counts each game as 3 game with the winner getting credit for a 2 games to 1 record unless they get 3-0 sweep credit for leading by 5+ runs after 8 innings without using their top reliever available.

Here is the recount of the more honest AL, where one game equals one game:

The Orioles put together an incredible second half to take the AL East title and number one seed.

Hard to believe they were (17-17) struggling in fourth place before ripping off an eleven-game win streak.

Toronto led the division most of the way before slipping behind the Rays in the final standings.

In the west, Seattle led most of the year, before Houston went on a late run to claim the division title.

No one ever led the division by more than two games all year. The Rangers underperforming offense held them back, but good pitching helped them claim the final playoff spot. Underperforming offenses were a theme throughout the league. (Astros, Rays, etc.)

The post-season should be wide open with no clear favorite since only four games separate the six seeds.

Only one game separates the four wildcard teams.

Individual Awards:

Statis-Pro AL MVP: Anthony Santander, BAL, led the league in home runs, RBI’s, 2nd in batting and runs scored.

Statis-Pro AL Cy Young: Andrew Heaney, TEX, in 13 starts finished 6-2, with a league best 2.19 ERA.

Statis-Pro American League Baseball

East W L Pct GB RS RA

Baltimore 31 19 .620 – 223 198

Tampa Bay 28 22 .560 3 187 153

Toronto 28 22 .560 3 231 198

New York 25 25 .500 6 212 179

Boston 20 30 .400 11 191 234


West W L Pct GB RS RA

Houston 29 21 .580 – 204 165

Seattle 27 23 .540 2 213 191

Texas 27 23 .540 2 190 205

Cleveland 24 26 .480 5 203 223

Chicago 14 36 .280 15 144 227

[Top Four Qualify]


Wildcard W L Pct GB       

Tampa Bay 28 22 .580 —

Toronto 28 22 .580 —

Seattle 27 23 .540 1

Texas 27 23 .540 1

New York 25 25 .500 3

Cleveland 24 26 .480 4


Leaders will be add this afternoon. We hit a formatting issue trying to do it by phone.


Click for the free Statis-Pro Master Baseball Game. Click here for 60 of the all-time great MLB teams, or on teams of many of the all-time great players on teams by nation or state with one sheet for each team. Or click on the 2023 pitchers and 2023 batters in card form. You simply print two teams cards and then either print theaster link above and fast action cards in master link or buy the dice to start playing. 


All-Time Hoops Updates Complete - Walton's UCLA and 1st All-Black Champs Texas Western


We have gone through and verified accuracy of all 179 all-time great teams, and you will now see a line at the top of each team when you print out the sheet of two teams you want to play from this list:


To go in reverse order, the cards for our all-time champs from our big tournament - Bill Walton's UCLA came out accurate when we ran the Version 2 calculations. We would expect them to score about 1.28 points per trip down the court against other great teams in the game, and allow 0.94 point per game so those AdjO and AdjD at the top of the card let you know about how good each team's office is. That results in an overall rating of +17, meaning against the average great team in the game UCLA would be about 17 points per 100 possessions better than the other great team based on the cards.

Keep in mind the average great team in the game would be about 21 points better than the average team in a given season, so the math then indicates that UCLA would actually be about 38 points better than the average team in a season.

This is accurate. In fact UCLA's average score during their undefeated season was 95-64, and their Strength of schedule was a +7, meaning the average team they played was 7 points better than the average team - so add that to the 31-point margin of victory and if UCLA had played just an average schedule of opponents it is estimated they would have won by 38 points per game.

Texas Western Cards Upgraded

However, when we did this advanced math with extra weight on tournament games over regular season games, some team cards were a bit better or worse than the original calculation. 

Texas Western is in the history books to win a national title starting all black players, even more significant since they won the title game against Adolf Ruff's all-white Kentucky team.

When we recalculated all teams we found we had shortchanged some and overestimated some.

In this case, the Texas Western Cards should have produced about an average 6-point loss against the other great teams in the game - but once we ran the updated math they are actually about four points better than we thought. We have not changed the cards for the teams that are slightly off but the temporary fix for all of them is to adjust the dunk range, so if you were to play Texas Western in the game right now you would use the same cards but simply change their dunk range from 51-52 to a 51-56 range.

Even at the new -2, Texas Western would still be 19 points worse than UCLA's +17. That actually means they would be about a 12-point underdog because games do not last 100 possessions unless you play Loyola Marymount in our game.

Math Detail only for Fellow Stat Nerds

With around 2/3rds as many possessions (66 or a few more depending on fouls or steals and fast breaks in the last five minutes of a Value Add Basketball Game) so if dice rolls were completely average for a whole game, UCLA would have a 12-point lead at the end of a Value Add Basketball Game, but if you continued another 30 possessions or so to get to 100 total possessions between the two teams, then on average UCLA would win by 19.

The reason the dunk range and defensive "adj dunk range" is the perfect tool for adjusting precisely for strength of schedule and different eras, as well as for home court advantage, is that every die roll from 11-66 should come up just more than one time per game for each team in a game.

Therefore before this adjustment, the 53, 54, 55 and 56 when Texas Western would not be a dunk, but after the adjustment they would be a dunk. So that is an average of just over four times a game Texas Western gets two points. At first this sounds like we have improved them by 8 points per game rather than four.

However, before the adjustment those die rolls just mean nothing happens and you look at the 20-sided die roll which could be a 3-pointer, 2 pointer, two shots at the line or a missed shot. The average of those combinations would give Texas Western more than 1 point per time, so the dunk range guarantees at least 2-points but sometimes they would have gotten 2 anyway, or sometimes they will hit a 3-pointer on the 20-sided die and the offense has the option of choosing a dunk OR the result of the 20-sided die. In the end, it comes out to one point per number in the dunk range.

Without this adjustment, the cards for Merrimack that went 12-4 to win the Northeast Conference would likely have player cards as good as Kansas, that went 13-5 in the Big 12. However, the level of competition that factors into the dunk range adjusts for the fact that Kansas average opponent was 17 points better than the average team last year while Merrimack's opponent was 17 points worse than average.

Therefore www.kenpom.com calculates Kansas was +23 points better than average while Merrimack was -11 worse than average.

Therefore after we calculate Kansas cards based on stats that were held down by facing such tough opponents, if the numbers on the card would add up to an average +12, then they have 11 dunk numbers to make them as good as they really were based on competition.


Sunday, September 24, 2023

UConn 2023 Sets Defensive Record with 77-39 Blasting of St. Peter's 2022

After three straight all-time great tournament games came down to the wire, our top seed in this tournament became the first team in our game to hold an opponent under 40 points with a 77-39 destruction of St. Peter's Cinderella Elite 8 team of 2022.

St. Peter's is the lowest rated team in the game, as they went 16-11 during the regular season in the MAAC despite only two games against power conference teams (both double digit losses) before winning the tournament and stunning Kentucky in the opening round of March Madness en route to the Elite 8. Despite the run, www.kenpom.com still ranked St. Peter's outside the Top 100. However, they were part of our third batch of teams added to the game to try to give as many schools as possible a team in the game.


However, the dunk ratings adjust for level of competition played and team defense beyond steals, Blocked shots and defensive rebounds. St. Peter's played the 137th toughest schedule in 2022 even counting the 4 March Madness games, while UConn played the 17th toughest in 2023. St. Peter's defense still holds up on because they were the 25th best defense in the country based on Www.kenpom.com, but they only had the 231st best offense adjusted for competition which is the basis for the dunk range being so low.


 St. Peter's resultant - 1 offensive rating (1 number as a STOP rather than a DUNK for the 51-66 dunk range) combined with the tough UConn defense dunk adjustment of -4 to give a range of 51-55 that was a stop (defender of player with the ball gets a rebound on a missed shot) and the Huskies dominated from the outset. Freshman Donavan Clingan scored early in route to 12 points as one of the best reserves in the game, and UConn completely shut down St. Peter's to advance 77-39 - the most lobsided game in the 216 games we have have played between great teams.

The most lobsided games and best defensive performances we've played so far appear below the box score.
 
St. Peter's 2022              Ht      Pos       Pts   Reb   Stl   Blk   Foul  Actual Season Stats          
Matthew Lee6'01-PG411046.8 Pts, 1.8 Reb, 2.9 Ast
Daryl Banks6'32-SG6120111.3 Pts, 2.6 Reb, 1.4 Ast
KC Ndefo6'73-SF6401210.5 Pts, 6.1 Reb, 2.4 Ast
Doug Edert6'24-PF430029.5 Pts, 2.5 Reb, 0.9 Ast
Fousseyni Drame6'75-C6110217.0 Pts, 6.4 Reb, 0.7 Ast
Jaylen Murray5'111-PG220025.8 Pts, 1.6 Reb, 1.6 Ast
Clarence Rupert6'82-SG210014.4 Pts, 2.6 Reb, 0.7 Ast
Hassan Drame6'73-SF250016.0 Pts, 5.3 Reb, 0.8 Ast
Isiah Dasher6'34-PF541134.8 Pts, 2.3 Reb, 0.8 Ast
Oumar Diahame6'105-C210011.9 Pts, 2.0 Reb, 0.0 Ast
Total Turnovers 11  39334418 
         
UConn 2023HtPosPtsRebStlBlkFoulActual Season Stats
Tristen Newton6'51-PG11611210.1 Pts, 4.5 Reb, 4.7 Ast
Andre Jackson6'62-SG672026.7 Pts, 6.2 Reb, 4.7 Ast
Alex Karaban6'83-SF1180119.3 Pts, 4.5 Reb, 1.7 Ast
Jordan Hawkins6'54-PF21410216.2 Pts, 3.8 Reb, 1.3 Ast
Adama Sanogo6'95-C8814117.2 Pts, 7.7 Reb, 1.3 Ast
Hassan Diarra6'21-PG210112.1 Pts, 1.3 Reb, 1.8 Ast
Joey Calcaterra6'32-SG240015.8 Pts, 1.7 Reb, 1.2 Ast
Nahiem Alleyne6'43-SF230015.2 Pts, 1.2 Reb, 0.8 Ast
Samson Johnson6'104-PF210010.9 Pts, 0.8 Reb, 0.1 Ast
Donovan Clingan7'25-C1230116.9 Pts, 5.6 Reb, 0.5 Ast
Total Turnovers 6  77455813


Fewest Points Allowed

39 - Connecticut 2023 allowed 39 by St. Peter's 2022, 77-39
44 - Kansas 2008 allowed 44 by Oklahoma 2016, 66-44
47 - Connecticut 2004 allowed by Butler 2010, 71-47
47 - Gonzaga 2017 allowed by Memphis 2008, 65-47
48 - Gonzaga 2017 allowed by UCLA 2006, 81-48
49 - Indiana 1976 allowed by Indiana 2002, 72-49

Biggest Blowout in our Value Add Basketball Games:

38 points - UConn 2023 beat St. Peter's 2022 by 77-39
34 points - Villanova 2018 beat Creighton 2020 by 81-48
33 points - Gonzaga 2017 beat UCLA 2006 by 81-48
33 points - Virginia 2019 beat Maryland 2002 by 97-64
32 points - Duke 2010 beat Wake Forest 2005 by 89-57
31 points - Kansas 2008 beat St. Joe's 2004 by 83-52


Verified Offensive And Defensive Ratings Added to Top of Teams - UConn 2023 vs. St. Peter's vs 2022

We have started to go through all of the team sheets to verify any tweaks needed to the dunk ranges, and to make it easier when you play the game we are listing a line across the top of the team sheet as shown below. 

We have made it through the first 27 pages of List A, listing the Offensive Rating (AdjO) and Defensive Rating (AdjD) of each team, and then to combined Game Rating - which is the first number minus the second number times 100 and then minus 17. The + or - number tells you how many points per 100 possessions each team is better or worse than the average team in the game.

If we have actually verified the exact numbers for a given team using the dunk calculator, like with the top seed in our current tournament (defending champions UConn) and their first tournament opponent (St. Peter's Cinderella Final 4 team from 2022) then we put "Verified" to let you now there will be no changes for cards. However, we applied our advanced calculations to see which cards will likely need an adjustment, and in those cases such as California 1959 where we realize the team will probably be upgraded about 3 numbers on the dunk range - in those cases we do what they did on their cards below - put in a temporary adjustment of California's cards from a 51-53 dunk range to a 51-56 range.

Because there is a 31 point gap between UConn and St. Peter's ranks we would expect UConn to be about 31 points better per 100 trips. Of course, basketball games only last about 2/3rds that many possessions, so we might peg UConn as a 20 point favorite.

After three straight tournament games coming down to the wire, we will see if our top seed can handle our bottom seed more easily - or if this will be another UVA vs. last seed.


Coach K's Last Duke Team Rallies Past Murray State Despite Morant's 30 Points

Ja Morant and Murray State dominated Coach Mike Krzyzewski's final Duke squad most of the way. With 18 possessions to play, Morant converted an "and-one" to make him 14 of 15 from the line, give Murray State a 63-56 lead, and give Wendell Moore his 4th foul after Jeremy Roach had already fouled out guarding Morant. Morant would finish with 30 points (see complete box score at bottom,and click Value Add Basketball Game. for the free game).

The game pitted Coach K's last team which made it to the 2022 Final Four, against Ja Morant's debut on the national stage, where his team destroyed Markus Howard and Marquette in the 2019 opening round the year before Morant was name NBA Rookie of the Year. 

Morant's NBA teammate Shaq Buchanan put up 28 points, while Duke had to put three players in the game who were not scheduled to play to cover the extra possessions at Point Guard. Joe Baker had to play the final 12 possessions even though his Stamina is only 6, meaning on the last 6 possessions all numbers were adjusted on against him due to fatigue.

However, with Murray State's other eight players combining for only 20 points, Duke's balance and size wore Murray State down in the end. Mark Williams, with the ultimate 21-26, 23 blocked shot range as a 7-footer, blocked a couple of shots that would have gone into tie the game late, and grabbed a game high 12 rebounds to help Duke to a 32-25 edge on the Boards, and Duke won the last 10 minutes 29-15 to pull the game out 85-78 to advance in our 4th all-time great tournament.

This is our 4th tournament using the all-time great teams in the Value Add Basketball Game. Our first men's all-time 96 greatest teams ever, but limiting each team to one team per century, concluded with Bill Walton's UCLA defeating Michael Jordan's UNC, 66-58 (see men's game log here). In our All-Time Women's tournament we believed the UConn 2010 and 2016 teams were the best two, but in the end it was Pat Summit's 1998 Tennessee 66 defeating Louisiana Tech led by then point guard Kim Mulkey 58. We then created another 50 teams and Paul Pierce' Kansas 1997 team destroyed the last Big Ten Champion (Mateen Cleaves 2000Michigan State) 85-61 for the second title. Those two were not included in the first batch because I had gone with Wilt Chamberlain's Kansas team and Magic Johnson's Michigan State team. On the women's side Pat Summit's Tennessee beat Notre Dame for the title. This tournament is between a third batch of additional teams created to catch a few more great teams from those schools that already had a few in the game, but with a bigger focus on getting new colleges at least one team - particularly making sure any team in one of the major conferences in 2024 have at least one team from their history.

Note: And yes, I am watching the Packers' game on TV like everyone else in Wisconsin as I roll my first dice of the game. I actually find it is easier to play a different board game sport then the sport I am watching TV. Otherwise I have moments where I do things like, "wait, did I just have a double on my game or was that a double in the gam eon TV LOL."

Because we are now making slight adjustments to some teams Dunk Ranges to make the game even more precise, note that I am starting to put at the top of the team if the team's dunk ranges have been "Verified." If this is not the case, and you see an adjustment listed by the team on the top of the google doc, then you can adjust the dunk range up or down by the number specified (biggest improvement possible is a +4, while worst is a -4, but most are unchanged). 

Both teams have a mediocre 0.99 defense A (expected to allow 0.99 points per possession against other great teams in the game), which was better than we expected for Duke 2022 who we improved from a +3 to 0 on the defensive adjustment. The reason Murray State has the same defensive rating but a slightly worse +1 is that their average defensive steals range is 4.2 while Duke's is 3.2 as shown on this dunk range calculator. Therefore Murray State on average steals the ball on a 11-14 and Duke on a 11-13 giving Murray State a slightly edge on defense, so the calculator balances this by giving Duke a slightly better +0 to Murray State's +1 on allowing open drives to the basket and they come out even at a 0.99 AdjD.

The other factors are equal for both teams, which both average 3.6 on blocked shots a 3.2 on defensive rebounds. A 3.0 is the average on all three of these factors, so both are at least above average on all three other defensive factors.

However, on offense Duke's 51-57 dunk range was verified as already accurate, while it turns out Murray State was lowered to no dunk range (their cards are good enough offensively to score the 1.03 per trip, but it takes 7 in the dunk range to get Duke to average 1.13 per trip with completely average dice rolls).

When you put it all together, when Murray State has the ball there is no dunk range so we ignore all rolls of 51-66 and go to the 20-sided die for the result of the shot or foul drawn.

When you go to the Value Add Basketball Game dunk charge, Duke's 51-57 dunk range and the +1 from Murray State's defense adds up to 51-58, but that is really a 51-62 in the game since these are two 6-sided dice so there are no rolls of 57, 58, 59 or 60.


We also wrote in the possessions we plan to play each player and will add it to the cards later. We use a penny on a player in the game who only gets the ball on one if the 1-5 rolls on the 7-sided die. The dimes indicate who also gets it on a 6, 7 or 8, and at the start of the game pictured, Morant gets the ball on a 6 and 7 in addition to a 1. However Duke starts the game with only 2 dimes.meaning a "8" goes.to no one and requires a second roll, and on that roll a 6-8 is a shot clock violation.


Game Results

Pos              Murray State 2019     Actual Stats                          Ht    Pts  Reb  Stls  Blks  Fls
1-PGJa Morant24.5 Pts, 5.7 Reb, 10.0 Ast6'3302213
2-SGLeroy Buchanan13.0 Pts, 4.2 Reb, 1.7 Ast6'3284113
3-SFTevin Brown11.8 Pts, 4.7 Reb, 2.3 Ast6'546102
4-PFDarnell Cowart10.3 Pts, 6.5 Reb, 1.1 Ast6'833004
5-CK.J. Williams7.6 Pts, 4.7 Reb, 0.5 Ast6'1024011
1-PGBrion Whitley3.0 Pts, 0.6 Reb, 0.3 Ast6'400001
2-SGJaiveon Eaves3.5 Pts, 0.9 Reb, 0.4 Ast6'200000
3-SFBrion Sanchious2.7 Pts, 2.9 Reb, 0.6 Ast6'854002
4-PFMike Davis3.2 Pts, 2.8 Reb, 0.6 Ast6'741111
5-CDevin Gilmore3.6 Pts, 2.8 Reb, 0.4 Ast6'621011
 Murray St. TotalsGame Turnovers 11 78255518
         
PosDuke 2022Actual StatsHtPtsRebStlsBlksFls
1-PGJeremy Roach8.6 Pts, 2.4 Reb, 3.2 Ast6'141105
2-SGWendell Moore13.4 Pts, 5.3 Reb, 4.4 Ast6'5152304
3-SFTrevor Keels11.5 Pts, 3.4 Reb, 2.7 Ast6'4161201
4-PFPaolo Banchero17.2 Pts, 7.8 Reb, 3.2 Ast6'10198222
5-CMark Williams11.2 Pts, 7.4 Reb, 0.9 Ast7'01012031
1-PGJaylen Blakes1.0 Pts, 0.7 Reb, 0.5 Ast6'121002
2-SGBates Jones1.4 Pts, 1.1 Reb, 0.4 Ast6'872101
3-SFJoey Baker4.5 Pts, 1.2 Reb, 0.4 Ast6'621002
4-PFAJ Griffin10.4 Pts, 3.9 Reb, 1.0 Ast6'641011
5-CTheo John2.8 Pts, 2.5 Reb, 0.4 Ast6'963002
 Duke TotalsGame Turnovers 9 85329621

Friday, September 22, 2023

Can Anyone Stop Indiana State's Bird or UCF's 7'6 Tacko Fall? Final added - 74-70 ISU


Post game update: Scroll to the bottom for the scoresheet on Indiana State's 74-70 survival against UCF. Larry Bird was a perfect 4 of 4 on 3-pointers for a game-high 16 points, but that was well below his average in 1979. He was guarded by Johnny Dawkins son and Michigan transfer Aubrey Dawkins and 7-foot-6 Tacko Fall rejected two of Bird's shots among Fall's six blocks in the Value Add Basketball Game matchup.

However it was the other NBA player on the court in Indiana State point guard Carl Nicks who stole the ball after a UCF offensive rebound with less than a minute left and a 72-70 score. UCF then had to use the "turnover or foul" defense to keep the game from ending. It was Nick's who they fouled after failing to get a steal, and despite being only an average free throw shooter (1-13 made in 20-side die or 65%) Nick's sank them both for the 74-70 final and UCF's final jumper at the horn was no good but irrelevant.

Indiana State advances with the win and will definitely be one of the top 11 seeds remaining so will get a bye to the third round while the 12th to 21st best first round winners will play in the 2nd round to make the Sweet 16.

The following was written before the game, and the scoresheet is at the bottom.

Pre game write up

Perhaps the most fun match-up in the first round of our current 42-team tournament is Indiana State's 1979 Runner-up team vs. Central Florida's (UCF).

For the set-up, Bird may have the best card in the entire Value Add Basketball Game. His "Gets ball on: 3 SF 6&8" means he gets the ball on three numbers on the 8-sided die, or 37.5 percent of the time, and once he gets it he hits a 3-pointer 30% of the time (1-6 on the 20-sided die). Keep in mind that doesnt mean he misses 70% of 3sz but rather 6 of 20 times he gets the ball in the game he makes a 3. Bird is an incredible rebounder on offense and defense (1-8) and has the max steals (11-20 which is the same as 11-16, 31 All) and almost as good at blocking shots (21-26). With the dunk range of 51-56 that could be the best offensive card in the game.

However, Indiana State is only a fair defensive team (+0 on dunk adjustment) and will need to go up against the only player who scores or is fouled on 17 numbers on the 20-sided die in Fall. He makes a 2-point shot on 1-11 and is fouled on 12-17, only missing a shot on an 18-20. His offensive rebound range of 1-9 means anytime a rebound comes up as "high on court" he would grab the rebound even over Larry Bird's defensive 1-8. He never steals the ball, but he does have the maximum blocked shot range of 21-26, 32 all (listed as 21-30 on some teams) which means he blocks a shot on the opposing center on 21-26 and when anyone in the game shoots on a 32. 

At first glance, someone might think his card would produce even more points than Bird's because of only missing on 3 numbers out of 20, but actually it is great but not nearly as great s Bird's for three reasons. First, his stamina is 30 of 44 possessions, so like many big men he is not on the court as much as Bird's 37 of 44. Second, while he goes to the foul line a lot, his free throws made are only good on a 1-7 out of 20 for a 35% free throw range. Finally Central Florida's 51-51 dunk range makes for a very low overall offensive rating due to lighter opponents during the year compared to Indiana State's 51-56 for a high powered overall offense.

Due to Central Florida's tough defense (-2) they hold Indiana State's dunk range down to 51-54, while Indiana State's weaker defense of 0 leaves Central Florida's dunk range for the game at 51-51.

We showed Indiana State's player cards at the top. Below that are the list of Offensive (Adj0) and Defensive (AdjD) overall point expectations of cards, with Indiana State at 1.14 points per trip in the game, and defense (AdjD) at 0.98. UCF is a weaker offense (1.03) but better defense (0.93).  Finaly for the stat nerds we include the calculation of both teams dunk range with formulas available in this google sheet.

We set up the box score at the bottom and will fill it in after the game.


Game Results to follow with conclusion of game.

Box Score. Next to each player there are 4 numbers for points, rebounds, steals and blocked shots. For Bird that was 16 points, 5 rebounds, 2 steals and 1 block. For Fall that was 12 points, 8 rebounds, 0 steals and 6 blocks.


Pos        Central Florida 2019      Season Stats                          Ht   Pts   Reb   Stl   Blk   Foul
1-PGTerrell Allen6.7 Pts, 3.2 Reb, 4.3 Ast6'3     
2-SGB.J. Taylor15.9 Pts, 2.3 Reb, 3.2 Ast6'2     
3-SFAubrey Dawkins15.6 Pts, 5.0 Reb, 1.4 Ast6'6     
4-PFCollin Smith8.0 Pts, 5.2 Reb, 1.5 Ast6'11     
5-CTacko Fall11.1 Pts, 7.6 Reb, 0.5 Ast7'6     
1-PGFrank Bertz3.1 Pts, 1.4 Reb, 0.5 Ast6'5     
2-SGCeasar DeJesus3.4 Pts, 0.9 Reb, 0.7 Ast6'2     
3-SFChance McSpadden0.9 Pts, 1.9 Reb, 0.4 Ast6'4     
4-PFDayon Griffin4.6 Pts, 2.1 Reb, 1.1 Ast6'4     
5-CChad Brown4.5 Pts, 5.0 Reb, 0.4 Ast6'9     
         
PosIndiana State 1979Season StatsHtPtsRebStlBlkFoul
1-PGCarl Nicks19.3 Pts, 3.5 Reb, 5.0 Ast6'1     
2-SGBob Heaton7.3 Pts, 3.3 Reb, 1.8 Ast6'5     
3-SFLarry Bird28.6 Pts, 14.9 Reb, 5.5 Ast6'9     
4-PFLeroy Staley7.0 Pts, 3.5 Reb, 0.7 Ast6'4     
5-CAlex Gilbert9.6 Pts, 6.1 Reb, 0.4 Ast6'7     
1-PGSteve Reed5.0 Pts, 1.9 Reb, 7.0 Ast6'3     
2-SGRich Nemcek1.7 Pts, 1.0 Reb, 0.6 Ast6'6     
3-SFScott Turner2.1 Pts, 1.1 Reb, 0.3 Ast6'5     
4-PFBrad Miley5.7 Pts, 6.0 Reb, 1.6 Ast6'8     
5-CTom Crowder1.9 Pts, 1.3 Reb, 0.2 Ast6'5    

Thursday, September 21, 2023

Duke's 90% FT Duo Saves Them From 2014 Nebraska, 75-72

 Nebraska's Terran Petteway torched Duke for 23 points to show how he finished the 2014 season dominating top 10 schools like Michigan State and Wisconsin to give the Cornhuskers 10 of 12 wins to close the regular season with their only NCAA bid of the century.

The Cornhuskers did not have any NBA players that year, and Duke had eight - behind only 1991 UNC and Duke 


Nebraska 2014             Pts  Reb  Stl  Blk  Fouls  Pos      Ht        Actual 2014 Stats               
Tai Webster212031-PG6'43.9 Pts, 2.1 Reb, 2.0 Ast
Ray Gallegos843022-SG6'27.3 Pts, 2.0 Reb, 1.4 Ast
Terran Petteway2341143-SF6'618.1 Pts, 4.8 Reb, 1.6 Ast
Shavon Shields1060044-PF6'712.8 Pts, 5.8 Reb, 1.6 Ast
Walter Pitchford960225-C6'109.3 Pts, 4.7 Reb, 0.5 Ast
Benny Parker822311-PG5'92.4 Pts, 1.0 Reb, 0.9 Ast
Deverell Biggs210012-SG6'19.9 Pts, 3.3 Reb, 1.5 Ast
David Rivers620013-SF6'73.0 Pts, 2.9 Reb, 0.4 Ast
Nathan Hawkins210014-PF6'51.4 Pts, 0.9 Reb, 0.3 Ast
Leslee Smith241225-C6'85.4 Pts, 4.8 Reb, 0.4 Ast
11 Neb Turnovers72319821   
         
Duke 2015PtsRebStlBlkFoulsPosHtActual 2015 Stats
Tyus Jones1621011-PG6'111.8 Pts, 3.5 Reb, 5.6 Ast
Quinn Cook1213022-SG6'215.3 Pts, 3.4 Reb, 2.6 Ast
Justise Winslow12132123-SF6'612.6 Pts, 6.5 Reb, 2.1 Ast
Jahlil Okafor1073144-PF6'1117.3 Pts, 8.5 Reb, 1.3 Ast
Amile Jefferson832115-C6'96.1 Pts, 5.8 Reb, 0.8 Ast
Rasheed Sulaimon210011-PG6'57.5 Pts, 2.0 Reb, 1.8 Ast
Matt Jones220032-SG6'56.0 Pts, 2.3 Reb, 1.0 Ast
Grayson Allen920013-SF6'44.4 Pts, 1.0 Reb, 0.4 Ast
Marshall Plumlee240014-PF7'02.2 Pts, 2.4 Reb, 0.3 Ast
Semi Ojeleye210015-C6'83.0 Pts, 2.3 Reb, 0.2 Ast
11 Duke Steals753611317  

Petteway tied the score 67-67 with six possessions to play in the Value Add Basketball Game after 3-point specialist Ray Gallegos (1-5 on the 20-sided die is a made 3-pointer) his a 3-pointer the previous possession. With two possessions left, Nebraska changed strategy to play for a 3-pointer, which means shooters add a 3-pointer for every 2-pointer made they can turn to a 2-pointer missed as long as they do not more than double the 3-pointers made. On the 20-sided die, Gallegos normally hits a 3-pointer on a 1-5, and a 2-pointer on a 6-7 - so with this strategy a 1-6 was a made 3-pointer and a 7 turned into a missed show. The ball came to him on a 2 roll (shooting guard) on the 8-sided dice and he drained the clutch shot on a "6" to pull Nebraska to within 70-73, and they got it to him for one last shot on the final roll of the game, but it fell short for a 72-75 loss.

Justise Winslow grabbed his 13th rebound of the game and Duke escaped to our second round. They were saved by 13-13 from the line from their two guards - Tyus Jones and Quinn Cook, both of whom make free throws on a 20-sided die roll of 1-18. Trailing 73-72, Nebraska had to use the "turnover or foul" strategy on the after cutting the lead to 73-72 to create and extra possession below the diagonal line on the final possession to get the ball back. 

When this strategy is used, the 20-sided die is not used since a shot will not happen. The 8-sided die still determines who gets the ball, and then if the two six-sided die (11-66 roll) come up as a turnover in the 41-46 range, or as a steal in the 11-16 range or 31, then there is a turnover but on any other roll the player who got the ball gets two free throws. Jones had already gone 9 of 9, but this intentional foul put Cook at the line to hit the final two to make it 75-72 and make that the final when Winslow grabbed his 13th rebound of the game at the other end.

Duke did drop to 53rd in our rankings which drops them below Rutgers 1976 to make them the 3rd seed for the next round as of now, but other teams who still need to play their first round game can still move up with a win if Alabama 2023 beats last year's Creighton team, Duke's 2022 team beat Murray State, or Larry Bird's 1979 Indiana State team beats Central Florida.

Here is box from the game and below that the top 11 seeds for the second round if the first round ended today (the 12th through 21st seeds will then play in against each other to determine which five winners of a second game advance to the Sweet 16 against the top 11 seeds after one round of play.

19           UConn 2023 still to play St. Peter’s 2019

43           Rutgers - 1976 - Phil Sellers

53           Duke – 2015 – Justise Winslow

60           Gonzaga - 2023 - Drew Timme

61           Kansas - 2022 - Ochai Agbaji

68           Houston 2023 vs Princeton

69           Marquette - 2023 - Tyler Kolek

75           Alabama 2023 vs Creighton 2023

84           Duke 2022 vs. Murray State 2019

85           Marquette - 1994 - Jim McIlvaine

86           Indiana State and Larry Bird 1979 vs Central Florida 2019


Dunk Calculation Reveal in VABG Game - Sample Duke 2015 vs. Nebraska 2014

 This post is more for fellow nerds as I prepare to play my next Value Add Basketball Game - Coach K's last national champions (Duke 2015) vs. Nebraska's only team to make the tournament this century - from the year before Duke's title in 2014.

We originally allowed only one team from each century for each school, but added yet another Duke team when we went through the greatest teams left out so far - though still limiting to just a few teams from each school in our 179 great all time teams. When the 2024 conference realignment was decided we would make sure every team in one of the big five conferences - the Power 5 football plus the basketball-only Big East - and 2014 was the team we chose for Nebraska.

The year before we went through the last couple of tournaments and picked a number of new teams starting with Ja LaMont's 2019 Murray State team. 

Having now added teams in a few waves, we wanted to also go back through and apply the exact same criteria for calculating the Dunk Ranges and defensive equivalent Adj Dunk Range. These are the most important final stat because they adjust for eras of play, and level of competition. Without the dunk range a team with the exact same stats playing SWAC opponents would have the exact same cards as a team with the exact same stats playing in a power conference. The dunk range calibrates very accurately to adjust for how each player would likely do playing against average competition.

We have not detailed how these are calculated until this blog. For starters, this google sheet contains all the calculations that go into the calculations. We are as precise in this as we were in determine that if a team is at home in a game then letting them flip any die result of 36 or 66 for the other would on average adjust to give the home team a 3 point a game advantage in an average game of rolls.

While we are going through the cards using the google sheet above to adjust teams dunk ranges, you can still keep playing with current cards. Only the dunk ranges and adj opp dunk ranges will be adjusted.

To show you the process, we will start with the Duke 2015 cards and calculations.


You go through the top row (starters only). Start with the point guard, Tyus Jones above, and below under "Die 1" you enter 2 for three-pointers made (1-2 range), 4 for two-pointers made (3-6 on his card), 4 for fouled (7-10 on card) then on Offensive Rebounds look at the range at the bottom and he actually has no offensive rebounds so gets a 0. 

Looking further down in the defensive section, you enter 5 for steals (1-5 on card), 1 for blocks (21-21) and 1 for defensive rebounds (1-1). You do this for all 5 positions. Then when you are done, you still need to see who gets the ball on rolls of 6, 7 and 8 and copy just the first four items for the player to the left who gets the ball on those rolls (but do not copy the offensive rebounds over - you can see they are blank below). 

Once all the numbers above the two yellow highlighted rows are entered, you turn your focus to the red number at the top, which are the offensive and defensive Adj (average points per possession the cards should produce when you play the game). 

You look at page 2 of the google doc above to get the target number for the team. The chart showed Duke should produce 1.21 points per trip against average competition, and in fact their dunk range of 51-60 calculated to 10 dunk numbers but that yielded a first red number that was too high. The next is trial and error. We tried lowering each "dunks" number to 9, and when we did that the expected Offensive efficiency did in fact adjust to 1.21. We adjust all the cards in the game for Duke 2015 to a 51-59 dunk range.

Likewise the defensive dunk adjust had been -2 when we first did the Duke cards, but that left their defensive Adj in red below 0.98, so we played with that and 0 is the number that go the number to the target 0.98 for expected points per trip Duke should be expected to give up in the game, so they get a 0 adjustment on defensive, which is just barely average, so weak for the game while the +9 on offense is strong.

Keep in mind that does not mean that a team with a +9 is better than a team with a +4 - it may be a team with a +4 has incredible numbers of 3-pointers made and offensive rebounds etc, and so only needs a slight adjustment on the dunk range to calibrate their offensive to be exactly as good as it should be.


Next we go to their opponent, Nebraska 2014. After all the same steps, Nebraska's dunk range was lowered from a 51-54 dunk range to no dunk range (which we list as 51-50 meaning no numbers to get to their target 0.98 efficiency, which is very weak in the game.

Their adjust dunk opponent range was -1 and that turned out to calculate perfectly to get them to the target 0.98 so no change was made to the card.


Taking all of the above, Duke's offensive dunk range is 51-59, and with Nebraska's -1 makes it 51-58, which actually adjusts in the table in the game shows that is actually a 51-62 in the game. If Duke has the ball and a 51-62 then the player has the option of dunking the ball - which he would take unless the 20-sided die was a 3-pointer made or if it drew a foul on a good player to foul him out of the game perhaps. 

Ironically the Nebraska offense was zero and the Duke defense was also zero, so if anything in the 51-66 dunk range comes up then nothing happens and we ignore and whatever happens on the 20-sided die is the result.

If Duke still had a -2 on their cards and Nebraska had a 0, then the result would be a negative 2, and in that case on the game chart it becomes a 51-52 but that is a STOP range, meaning the player simply misses the shot and the one defending him gets a defensive rebound.


Wednesday, September 20, 2023

All-time great Teams Reseeded; 1, UConn 2023; 2, Duke 2015; 3, Houston 2021; 4, Alabama 2023

Rating    Great Team, Year, Player                     Won  Lost  Score  Allow  Opp SOS  Rating
43Rutgers - 1976 - Phil Sellers1097.077.0-9.02.0
60Gonzaga - 2023 - Drew Timme1086.074.0-6.70.7
61Kansas - 2022 - Ochai Agbaji1087.081.0-7.90.6
68Marquette - 2023 - Tyler Kolek1090.081.0-1.8-0.3
85Marquette - 1994 - Jim McIlvaine1080.078.0-1.4-2.2

The teams above have already advanced as five of the eventual 21 winners in our new tournament. They all shot up in the ratings due to their win, except for Kansas 2002 that dropped after barely surviving against Virginia Tech and Steph Curry's dad Dell Curry. The rating starts as the teams projected SRS better or worse than the average great team in our game, then is adjusted up or down based on a formula similar to that for current teams at www.kenpom.com exceptwe rate the win or loss a little higher.

We did redo the Value Add Basketball Match-ups after our project to recalibrate to get every team's dunk ranges, which adjust for level of competition and era played etc, into one uniform system. Give of our new teams had already played and advanced to our unusual "Round of 21" from which we will reseed.

Here are the other 16 games on the reset schedule.

UConn 2023 passed Duke 2015 for the top spot of the remaining teams after the recalibration. UConn now calculates as the 19th best team of all time and Duke as the 31st of all time. As a result:

UConn now gets the lowest seeded team, the St. Peter's team that made the shocking Elite 8 run in 2022. 

Slipping to the No. 2 seed puts Duke up against the Nebraska 2014 team.

In the latest round of additions we made a special effort to get any teams in one of the big conference who had no team in the game to add the best team we could find from this century.

The No. 3 seed is the Houston 2021 Final Four team, and they get Princeton's 2023 team - giving them a 21st Century team since they already had Bill Bradley's team from the last century.

The No. 4 seed is the 2023 Alabama team, the best team of the regular season though they were outmuscled in the  Sweet 16 by an older squad. We apologize for an error in last week's blog. I typo in one excel cell made us accidentally list Alabama as dropping way out of the top 150 teams of all time. We caught the mistake and they actually rank as the 75th best of all time, and 4th best of these 32 teams.

The #5 and #6 teams have the most history, with Coach K's last Duke team from 2022, and then Larry Bird's 1979 National Runners-up. We only had 31 new teams who had yet to play a game, so we added Indiana State as the most interesting team with only one game played in our game - and they were one of the teams that benefitted from our upgraded system.

Once we have 16 winners from this group we will add them to the five at the bottom who already won, and adjust rankings based on these results and reseed with the top teams then getting the byes. 

Winners in red
 
Tourney   Best Card                     Rnk     Champion          Year
1Adama Sanogo19UConn2023
32Doug Edert174St. Peter's2022
2Justise Winslow31Duke2015
31Terran Petteway171Nebraska2014
3Quentin Grimes68Houston2021
30Tosan Evbuomwan170Princeton2023
4Brandon Miller75Alabama2023
29Ryan Kalkbrenner163Creighton2023
5Wendell Moore84Duke2022
28Ja Morant 161Murray St.2019
6Larry Bird86Indiana St.1979
27Joey Graham147Central Florida2019
7DeAndre Kane90Iowa St.2014
26Brook Lopez144Stanford2008
8Armando Bacot96North Carolina2022
25Jared Dudley143Boston College2006
9Santiago Vescovi98Tennessee2023
24Shane Larkin142Miami2013
10Marcus Carr101Texas2023
23Vic Law137Northwestern2017
11Semi Ojeleye107SMU2017
22Brandon Roy135Washington2006
12Charlie Ward111Florida St.1993
21JaKobe Coles129TCU2023
13Jaedon LeDee114San Diego St.2023
20Tony Carr128Penn St.2018
14JD Notae115Arkansas2021
19Markquis Nowell126Kansas St.2023
15Logan Johnson117St. Mary's2023
18Jack Nunge124Xavier2023
16Norchad Omier118Miami2023
17Johnell Davis119Florida Atlantic2023


Saturday, September 16, 2023

Acuna 6-6 in 12-4 win, 7-1 nightcap - Statis-Pro Baseball Play Returns with A's vs. Braves

 In game update: the game started like a best against worst matchup with four straight hits from the braves to start the game with a 2-0 lead. However in the bottom of the first a z-play injury changed things when Harris and Rosario collided in centerfield so will both miss the entire two games to shuffle the Braves lineup.

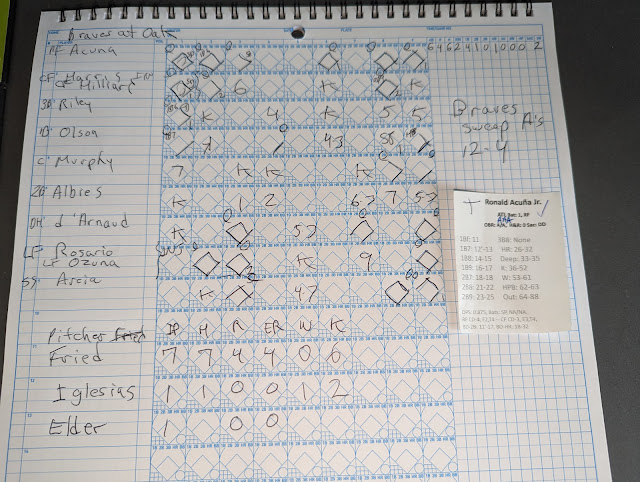
Well, they overcame the injuries. Ronald Acuna went 6 for 6 with a homer, double, 2 steals and 4 runs scored in a 12-4 win.

The A's wasted a great start by Adrian Martinez who struck out 5 of the first 6 Braves. This would have only been a 4-1 loss to count as 2 games to 1, except that ace reliever Hogan Harris bobbled a grounder that would have ended the 8th. Instead Marcel Ozuna came up and hit a 3-run homer for a 7-1 win which counts as a 3-game sweep due to the ng up by 5+ runs after 8 innings. The Braves 6-game sweep makes them 38-22 with two series left meaning the 36-18 Dodgers must at least split with the Twins to stay in 1st. The two teams seem to have the two byes locked up regardless.


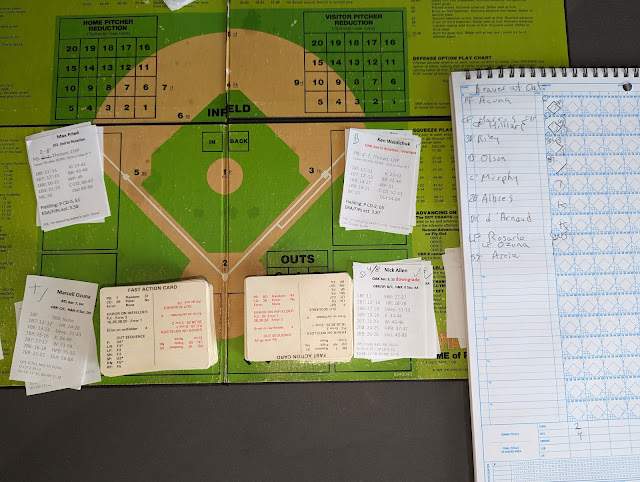
We’ve detoured from our Statis-Pro season due to some 14 hour work days, and some Value Add Basketball Game offseason breakthroughs. However, in the Field of Dreams State today for a Presidential Forum, we had time this morning to put the Braves up against their last relegated opponent, the Oakland A’s, in a series as they try to overcome the Dodgers for 1st place.

The two teams are also in the top two spots for byes in the actual MLB season, but in reverse order. Here are the pitching matchups. Results to follow and we are listing the rest of the pitching matchups for our season below, as well as notes on some key player cards that can be added to teams or that we are not using due to 60-day DL or being out for the season.

 The Braves also have three in their lineup who lower the opposing pitchers PB by one due to huge improvements in season over their projected ops - Ronald Acuna (also updated to a steal AAA), Sean Murphy and Orlando Arcia.


Series 10 (series 11 and the final 12 listed further down)

Atl 32-22, 2nd vs. Oak Relegated (Charlie Morton and Max Fried vs. Ken Waldichuk and Adrian Martinez)

LAD 36-18, 1st vs. Min Relegated (Tony Gonsolin and Bobby Miller vs. Sonny Gray and Kenta Maeda)

Ari 28-26 4th vs. SF 27-27 5th (Merrill Kelly and Tommy Henry vs. Alex Cobb and Alex Wood)

Braves cards that can now be used

Kyle Wright’s card is back


Braves cards that cannot be used (60 day DL, gone for season or left organization)

Michael Soroka Shut Down For Season

Dylan Lee – gone, out for season

Yonny Chirinos To 60-Day IL


A’s cards that can now be used

left-hander Sean Newcomb

Claimed Buddy Kennedy

Claimed Devin Sweet From Mariners

The A’s have claimed right-hander Spenser Watkins off waivers from the Astros

Dany Jimenez was activated from the 60-day


A’s cards gone

Right Freddy Tarnok underwent surgery

Richard Lovelady was moved from the 15-day IL to the 60-day

Righty James Kaprielian was transferred from the 15-day to the 60-day IL

Athletics right-hander James Kaprielian underwent successful right shoulder arthroscopic surgery today with Dr.

Diamondbacks acquired infielder Jace Peterson and cash from the A’s

It doesn’t look like either team has had any big card changes since the trade deadline. The bigger moves we see are Josh Donaldson going via waivers from the Yankees to the Brewers, and in our game rules the Marlins getting Sandy Alcantara for his last start since it was announced they have not ruled out him pitching again this year after the UCL Sprain. If it is announced a player it gone for the season then we stop using his card. The other big moves by other teams are the Reds adding Harrison Bader from the Yankees, the Marlins grabbing Dominic Leone from the Angels, and the Guardians claiming three players from the Angels – Luis Giolito, Matt Moore and Reynaldo Lopez. On a bad note, Julio Urias card is not being used due to his suspension for alleged domestic abuse.


Series 11 (No. 1 and No. 4 starters for last appearance)

ChC vs. Mia (Mark Leiter and Jameson Taillon vs. Sandy Alcantara and Johnny Cueto)

Phi vs. LAD (Zack Wheeler and Cristopher Sanchez vs. Clayton Kershaw and Lance Lynn)


Series 11.5 (No. 1 and 4 starters for 1st team listed, No. 2 and 3 for 2nd team listed)

Cin vs. zKC (Andrew Abbott and Brandon Williamson vs. Kris Bubic and Daniel Lynch)

Atl vs. SF (Spencer Strider and Kyle Wright vs. Alex Cobb and Alex Wood)

Mil vs. Mia (Corbin Burnes and Eric Lauer vs. Trevor Rogers and Johnny Cueto)

Ari vs. zLAA (Zac Gallen and Brandon Pfaadt vs. Tyler Anderson and Patrick Sandoval)

SF vs. ChC (Logan Webb and Sean Manaea vs. Justin Steele and Marcus Stroman)


Series 12 (No. 2 and 3 starters for both teams)

Ari vs. Atl (Merrill Kelly and Tommy Henry vs. Charlie Morton and Max Fried)

Mil vs. Phi (Brendon Woodruff and Freddy Peralta vs. Aaron Nola and Michael Lorenzen)

Cin vs. LAD (Hunter Greene and Nick Lodolo vs. Tony Gonsolon and Bobby Miller)