Sunday, April 22, 2018

NFL Draft Takes Most Early Talent From; 1) LSU, 2) Bama, 3) Texas, 4) Stanford, 5) Ohio State

While college seniors prepare for graduation in the coming weeks, the following student-athletes chose to instead enter this week's NFL draft before their senior year of college football. We took a look at the teams hurt the most by talented players leaving early.

We calculated 25 points for losing a player who would be one of the first few picks, all the way down to 2 points for a player who left early but might not even be drafted. Admittedly I go into more detail on the student-athletes leaving early for the NBA draft and the projections for all remaining players and their teams (click here), but the NHL, baseball and NBA drafts are not until June so here is the focus on this week's NFL draft.

The hardest hit team was LSU, which loses running back Derrius Guice (23 of 25 possible points), defensive backs Donte Jackson and Kevin Toliver (20 and 19), linebacker Arden Key (18), center Will Clapp (C) and then some minor players in Toby Weathersby and Travonte Valentine (tackle and nose tackle both worth two points). All together, that tallies 100 points even.

We list LSU's players first on the table below, and then we list the rest of the teams who lost someone early to the draft in alphabetical order. This worked out nicely because Alabama appears first alphabetically and happens to also be the second hardest hit with 87 points lost between five players. However, you will have to scroll down alphabetically to see the next three hardest hit in Texas, Stanford and Ohio State. I will actually be on Ohio State's campus for graduation weekend due to working on a redistricting ballot measure in the state for www.takeback.org - which has more student signups there than on any other campus. We will keep updates coming at www.pudnersports.com.

TeamPlayers lost to draft before senior yearValuePos
LSU1 rank, LSU lost 7 early entrees100Team 1
LSUDerrius Guice23RB
LSUDonte Jackson20DB
LSUKevin Toliver19DB
LSUArden Key18LB
LSUWill Clapp17C
LSUToby Weathersby2T
LSUTravonte Valentine2NT
Alabama2 rank, Alabama lost 5 early entrees87Team 2
AlabamaMinkah Fitzpatrick24DB
AlabamaCalvin Ridley24WR
AlabamaRonnie Harrison21DB
AlabamaBo Scarbrough16RB
AlabamaDa'Ron Payne2NT
Arizona St.36 rank, Arizona State lost 3 early entrees18Team 36
Arizona St.Christian Sam15LB
Arizona St.JoJo Wicker2DT
Arizona St.Sam Jones2G
Auburn8 rank, Auburn lost 4 early entrees58Team 8
AuburnCarlton Davis22DB
AuburnKerryon Johnson21RB
AuburnJeff Holland12LB
AuburnKamryn Pettway2RB
Benedictine47 rank, Benedictine lost 1 early entrees2Team 47
BenedictineMatt Fleming2WR
Boise St.27 rank, Boise State lost 1 early entrees23Team 27
Boise St.Leighton Vander Esch23LB
Clemson29 rank, Clemson lost 4 early entrees22Team 29
ClemsonDeon Cain10WR
ClemsonTaylor Hearn8G
ClemsonRay-Ray McCloud2WR
ClemsonVan Smith2DB
Colorado28 rank, Colorado lost 1 early entrees23Team 28
ColoradoIsaiah Oliver23DB
Florida14 rank, Florida lost 3 early entrees43Team 14
FloridaTaven Bryan22DT
FloridaAntonio Callaway19WR
FloridaEddy Pineiro2K
Florida St.18 rank, Florida State lost 4 early entrees32Team 18
Florida St.Tarvarus McFadden14DB
Florida St.Josh Sweat14DE
Florida St.Auden Tate2WR
Florida St.Jalen Wilkerson2DE
FSU21 rank, FSU lost 2 early entrees27Team 21
FSUDerwin James25DB
FSURyan Izzo2TE
Georgia15 rank, Georgia lost 2 early entrees42Team 15
GeorgiaRoquan Smith25LB
GeorgiaTrenton Thompson17DT
Houston41 rank, Houston lost 1 early entrees13Team 41
HoustonKyle Allen13QB
Indiana42 rank, Indiana lost 1 early entrees13Team 42
IndianaSimmie Cobbs13WR
Iowa12 rank, Iowa lost 2 early entrees48Team 12
IowaJames Daniels24C
IowaJosh Jackson24DB
Kansas35 rank, Kansas lost 1 early entrees18Team 35
KansasDorance Armstrong18DE
Kansas St.43 rank, Kansas State lost 2 early entrees11Team 43
Kansas St.Byron Pringle10WR
Kansas St.DJ Reed2DB
Louisiana-Monroe48 rank, Louisiana-Monroe lost 1 early entrees2Team 48
Louisiana-MonroeJJ Dallas2DB
Louisville6 rank, Louisville lost 3 early entrees65Team 6
LouisvilleLamar Jackson25QB
LouisvilleJaire Alexander24DB
LouisvilleGeron Christian16T
Marshall39 rank, Marshall lost 1 early entrees15Team 39
MarshallChase Litton15QB
Maryland17 rank, Maryland lost 2 early entrees35Team 17
MarylandDJ Moore23WR
MarylandJC Jackson12DB
Miami16 rank, Miami lost 4 early entrees38Team 16
MiamiRJ McIntosh18DT
MiamiKendrick Norton10DT
MiamiMark Walton9RB
MiamiCourtel Jenkins2DT
Middle Tennessee46 rank, Middle Tennessee lost 1 early entrees5Team 46
Middle TennesseeRichie James5WR
NC St.19 rank, NC State lost 2 early entrees32Team 19
NC St.Will Richardson16T
NC St.Nyheim Hines16RB
Nebraska40 rank, Nebraska lost 2 early entrees14Team 40
NebraskaTanner Lee9QB
NebraskaNick Gates6T
Nevada49 rank, Nevada lost 1 early entrees2Team 49
NevadaVosean Crumbie2DB
Notre Dame10 rank, Notre Dame lost 3 early entrees56Team 10
Notre DameQuenton Nelson25G
Notre DameJosh Adams16RB
Notre DameEquanimeous St Brown15WR
Ohio St.5 rank, Ohio State lost 3 early entrees65Team 5
Ohio St.Denzel Ward25DB
Ohio St.Sam Hubbard21DE
Ohio St.Jerome Baker19LB
Oklahoma13 rank, Oklahoma lost 4 early entrees47Team 13
OklahomaMark Andrews22TE
OklahomaOrlando Brown21T
OklahomaDu'Vonta Lampkin2DT
OklahomaDwayne Orso-Bacchus2T
Ole Miss38 rank, Ole Miss lost 1 early entrees16Team 38
Ole MissBreeland Speaks16DE
Oregon St.45 rank, Oregon State lost 1 early entrees10Team 45
Oregon St.Ryan Nall10RB
Penn St.22 rank, Penn State lost 1 early entrees25Team 22
Penn St.Saquon Barkley25RB
Pittsburg St.50 rank, Pittsburg State lost 1 early entrees2Team 50
Pittsburg St.Juante Baldwin2DB
Pittsburgh24 rank, Pittsburgh lost 3 early entrees25Team 24
PittsburghBrian O'Neill22T
PittsburghJordan Whitehead2DB
PittsburghQuadree Henderson2WR
Purdue51 rank, Purdue lost 1 early entrees2Team 51
PurdueEddy Wilson2DT
San Jose St.52 rank, San Jose State lost 1 early entrees2Team 52
San Jose St.Frank Ginda2LB
SMU20 rank, SMU lost 2 early entrees31Team 20
SMUCourtland Sutton24WR
SMUTrey Quinn7WR
South Carolina26 rank, South Carolina lost 1 early entrees23Team 26
South CarolinaHayden Hurst23TE
Southeastern Louisiana53 rank, Southeastern Louisiana lost 1 early entrees2Team 53
Southeastern LouisianaMaea Teuhema2T
Southern Miss54 rank, Southern Miss lost 1 early entrees2Team 54
Southern MissKorey Robertson2WR
Stanford4 rank, Stanford lost 4 early entrees70Team 4
StanfordHarrison Phillips21DT
StanfordJustin Reid18DB
StanfordDalton Schultz17TE
StanfordQuenton Meeks15DB
Tennessee32 rank, Tennessee lost 3 early entrees19Team 32
TennesseeRashaan Gaulden10DB
TennesseeJohn Kelly7RB
TennesseeReginald McKenzie2DT
Texas3 rank, Texas lost 6 early entrees82Team 3
TexasConnor Williams23T
TexasMalik Jefferson22LB
TexasDeShon Elliott14DB
TexasHolton Hill12DB
TexasMichael Dickson7P
TexasChris Warren4RB
Texas A&M30 rank, Texas A&M lost 1 early entrees21Team 30
Texas A&MChristian Kirk21WR
Texas Tech44 rank, Texas Tech lost 1 early entrees11Team 44
Texas TechKeke Coutee11WR
Toledo55 rank, Toledo lost 1 early entrees2Team 55
ToledoOlasunkanmi Adeniyi2DE
UCF31 rank, UCF lost 2 early entrees19Team 31
UCFJordan Akins18TE
UCFTre'Quan Smith2WR
UCLA9 rank, UCLA lost 4 early entrees57Team 9
UCLAJosh Rosen25QB
UCLAKolton Miller24T
UCLAJordan Lasley6WR
UCLAAustin Roberts2TE
UNC56 rank, UNC lost 1 early entrees2Team 56
UNCAndre Smith2LB
USC11 rank, USC lost 4 early entrees55Team 11
USCSam Darnold25QB
USCRonald Jones22RB
USCDeontay Burnett6WR
USCRasheem Green2DT
Virginia Tech7 rank, Virginia Tech lost 3 early entrees59Team 7
Virginia TechTremaine Edmunds25LB
Virginia TechTim Settle20DT
Virginia TechTerrell Edmunds14DB
Wake Forest37 rank, Wake Forest lost 1 early entrees17Team 37
Wake ForestJessie Bates17DB
Washington25 rank, Washington lost 1 early entrees24Team 25
WashingtonVita Vea24NT
Washington St.34 rank, Washington State lost 2 early entrees18Team 34
Washington St.Hercules Mata'afa17DE
Washington St.Tavares Martin2WR
Western Kentucky57 rank, Western Kentucky lost 1 early entrees2Team 57
Western KentuckyJoel Iyiegbuniwe2LB
Wisconsin33 rank, Wisconsin lost 1 early entrees19Team 33
WisconsinNick Nelson19DB
Wyoming23 rank, Wyoming lost 1 early entrees25Team 23
WyomingJosh Allen25QB

Projected 1st Round March Madness Match-ups; Recent Transfer Winners and Losers

After another 100+ updates this weekend on transfers, signings, NBA departures and other college basketball moves, here are the projected 1st round March Madness games based on player projections at www.valueaddbasketball.com (allow edits at https://tinyurl.com/y9mr9uu4). After the list, we lay out recent moves and which colleges were the biggest winners and losers.


RnkTeamValue ProjectionConfSeed1st Round NCAA Match-ups
1Kentucky67.07SEC1Lehigh/Texas Southern Winner
2Villanova57.26BE1Stephen F. Austin/Howard winner
3Kansas56.58B121Vermont
4Nevada56.55MWC1New Mexico St.
5Oregon55.99P122St. Francis PA
6Auburn55.56SEC2Northern Kentucky
7Duke54.37ACC2UC Davis
8Mississippi St.49.22SEC2Rider
9North Carolina48.92ACC3Liberty
10UCLA46.17P123Belmont
11Gonzaga45.87WCC3Georgia St.
12Syracuse45.27ACC3Marshall
13Tennessee45.05SEC4Lipscomb
14Maryland44.78B104UNC Greensboro
15LSU44.15SEC4Harvard
16Virginia44.12ACC4Buffalo
17Virginia Tech41.66ACC5Loyola Chicago
18Ohio St.41.55B105Houston
19North Carolina St.41.5ACC5Davidson
20Marquette41.45BE5BYU/Michigan winner
21Michigan St.41.44B106Washington/San Diego St. winner
22South Dakota St.40.36Sum6Indiana
23USC39.83P126Alabama
24Florida39.7SEC6Notre Dame
25Texas39.33B127Boston College
26Montana39.18BSky7Iowa St.
27Miami FL38.22ACC7Creighton
28Arizona St.38.02P127Wisconsin
29Northeastern37.88CAA8Northwestern
30Florida St.37.62ACC8TCU
31Kansas St.37.5B128Providence
32Iowa36.88B108Texas Tech

And here are teh biggest winners and losers in recent updates at https://tinyurl.com/y9mr9uu4.


RnkRecent ChangeBiggest Recent WinnersLoserValue
75Omer YurtsevenGeorgetown in 2020NC State7.04
78Ashton HagansKentuckyhis highschool7.00
174Blake FrancisRichmond in 2020Wagner5.88
212DeSean MurrayNot yet knownAuburn5.45
297MaCio TeagueAvailable in 2020UNC Asheville4.89
326Ryan WelageXavier in 2020San Jose State4.66
328Brandon WilliamsOregon/Crystal BallNone4.65
382Austin ReavesNot yet knownWichita St.4.32
442Zach JohnsonMiami FLFlorida Gulf Coast4.10
440Ronnie HarrellDenverCreighton4.10
444Courtney RameyLouisville/Crystal BallNone4.09
469Carlton Bragg 15New Mexico in 2020Arizona State3.98
502Kassoum YakweConnecticutSt. John's3.85
505Marcus BurkAvailable in 2020Campbell3.84
598Justin GorhamAvailable in 2020Towson3.57
656Juwan GrayAvailable in 2020San Diego3.35
669David CaraherSt. John's in 2020Houston Baptist3.32
783Nick NortonDrakeUAB2.97
830Austin NehlsBall St.Central Connecticut State2.78
846Joseph ChartounyMarquetteFordham2.75
880Eric LockettNot yet knownFlorida International2.66
897Jacob YoungRutgersTexas2.63
908Antwann JonesMemphis/Crystal BallNone2.60
930James AkinjoGeorgetown/Crystal BallNone2.56
957Matthew MoyerVanderbilt in 2020Syracuse2.50
974Jordan JonesAvailable in 2020Charleston Southern2.46
1060Jordan NoblesOaklandEastern Michigan2.23
1090Izaiah BrockingtonUnknownSt. Bonaventure2.20
1114CJ JonesNot yet knownArkansas2.19
1134Mason FaulknerAvailable in 2020Northern Kentucky2.14
1149Josh McFolleyAvailable in 2020Detroit2.11
1162Bobby PlanutisNot yet knownMount St. Mary's2.07
1172Tyler HarrisMemphis/Crystal BallNone2.06
1242Jy'lan WashingtonTennessee StateLouisiana Tech1.90
1260Justin ThomasAvailable in 2020Northern Illinois1.88
1290Nedeljko PrijovicMaine in 2020Texas State1.82
1301Tarin SmithConnecticutDuquesne1.81
1310Aaron CalixteOklahomaMaine1.78
1343Blake HinsonMississippi/Crystal BallNone1.70
1382Andy Van VlietWilliam & Mary in 2020Wisconsin1.63
1432Caleb McConnellRutgers/Crystal BallNone1.50
1519Lukas KisunasArizona/Crystal BallNone1.35
1800Payton WillisMinnesotaVanderbilt1.06


adadd

Sunday, April 15, 2018

15 players being dropped from Value Add Projections - Headed for NBA

As a follow-up to other articles, here are all the players being dropped from the Value Add Basketball database of 2019 projections, still leaving more than 5,400 players or open roster spots. Khyri Thomas has actually been added back into the database because he did not sign an agent.

Player out of ProjectionsHeightTeam losing playerValue
Mikal Bridges #256-foot-7Villanova11.06
Jalen Brunson #16-foot-2Villanova10.44
Moe Wagner #136-foot-11Michigan8.58
Landry Shamet #116-foot-4Wichita State8.17
Khyri Thomas #26-foot-3Creighton/could go NBA   8.03
Anfernee Simons6-foot-4High School7.80
Malik Newman #146-foot-3Kansas7.42
Marcus Derrickson #246-foot-7Georgetown6.86
Hamidou Diallo #36-foot-5Kentucky5.64
Mustapha Heron #56-foot-5Auburn5.38
Lonnie Walker #46-foot-5Miami FL5.09
Trevon Duval #16-foot-3Duke4.38
Justin Jackson #216-foot-7Maryland1.18
Drew Edwards #256-foot-4Providence0.77
Dikembe Dixson #106-foot-7Chicago State0.40
Fred Sims #146-foot-4Chicago State0.30

Saturday, April 7, 2018

Statis-Pro Standings, Pre-season ranking based on cards and Results (2018 Rosters, 2017 Player Cards) - All-Star results added

We keep the updated standings of the current AL season we are playing here, and while the sample size of games is low enough that there are always some surprises (think of the Mets start early this year), right now our season lines up with four of the same five teams in line for the playoffs as in actual play. The exceptions is the lowly Orioles are actually one game ahead of the real-life surprising Mariners for the last playoff spot. The White Sox have also played well above their real season.

The two differences between the real season and our simultaneous play is that we use cards based on last year's stats, and we let anyone on the roster play even if they are injured or suspended. Two of the reason the White Sox and Orioles are better in Statis-Pro are the great hitting cards of Colby Rasmus, who was actually out most of the season before quitting baseball again, and Welington Castillo, who looked like a big time pick-up in our game but has been serving an 80-day suspension in real life. All that and the variable luck plays in a short season and here are the AL standings followed by how our All-Star games went in Statis-Pro.

AL TeamWLGBWin%New OpponentIF playoffs today
Houston251100.694MilwaukeeAL West Pennant
New York2313-20.639NY MetsAL East Pennant
Boston2115-40.583CincinnatiWild Card host
Cleveland2418-40.5714-2 v PittsburghAL Central
Baltimore2016-50.556Chicago CubsWild Card visitor
Seattle1917-60.528San Diego
Chicago2220-60.5242-4 vs Washington
Kansas City1719-80.472Atlanta
Oakland1620-90.444Colorado
Minnesota1422-110.389Philadelphia
Los Angeles1422-110.389Miami
Tampa Bay1422-110.389NL
Texas1422-110.389LA Dodgers
Toronto1323-120.361Arizona
Detroit1323-120.361San Francisco

NL Wins All-Star Series two games to one with two cliffhanger wins


Game 1 (NL 4, AL 3) – As soon as Clayton Kershaw was gone, Carlos Correa’s homer and Gary Sanchez rbi as part of a 2 of 3 days gave the NL a 2-1 lead and a 7-3 edge in hits through three innings that held up into the 7th inning.

However, a 2-run homer by the Cubs’ Anthony Rizzo and solo shot by the Rockies Trevor Story rallied the NL in the 7th and 8th to take a dramatic 4-2 lead with Corey Knebel striking out the side in between for the win and the Cubs Brandon Morrow pitching through an error, walk and hit in the 9th for a dramatic opening game win.

Game 2 (NL 2, AL 1 in 12 innings) Brandon Morrow appeared ready to wrap up a Game 2 shutout when the NLs great defense (3b Arenado throwing a runner out at home, and Molina throwing Trout out stealing) was replaced with a dropped line drive at first base by Posey and a rare bobbled pitch by Molina to let a runner get to third who then scored an unearned run to force extra innings.

However, Herrera doubled in the top of the 12th and Parra’s sac fly to right clinched the series with a 2-1 12th inning run once Hendricks worked the 11th and 12th for a win as he induced Judge to ground into a double play to end the 11th and Altuve to strikeout to end the game.

Game 3 (AL 5, NL 2) Gary Sanchez was moved in front of Adrian Beltre in the lineup for Game 3 – and belted a homer-hitting after Yankees teammate Aaron Judge to spark the AL to salvage a game. Justin Verlander pitched three scoreless innings, and Mike Moustakas came off the bench to drive in two more runs for a 5-0 lead.

The NL did get to Ranger Alex Claudio to cut the lead to 5-2, but the Indians-Red Sox combo of Andrew Miller and Craig Kimbrel was once again shut down to get the Hold and the Save to salvage the final of the three games and actually give the AL the better run differential.

While the NL won the series on two cliffhangers, the AL not only had a 9-8 edge in run differential in the three-game series and destroyed the NL in the futures game 7-2 as Ohtani went three shut out innings for the win. Tampa’s Field hit two homers for 5 RBIs, and the Yankees Austin had two runs and doubles on a three of four day, and the White Sox Palka added a single and an RBI triple.

Here is the composite box for the All-Star Games:


PosAll-Start Line-UpTeamABHHRRBIRNotes
CFGeorge SpringerHou71000
SSCarlos CorreaHou72111
DHMike TroutLA71001
RFAaron JudgeNY82001
3BAdrian BeltreTex51000
CGary SanchezNY73121Gm 3 HR in win
2BRobinson CanoSea51000
1BEdwin EncarnacionCle63001
LFAndrew BenintendiBos51000
PosReservesTeamABHHRRBIRNotes
2BJose AltuveHou71000
SSJeimer CandelarioDet20000
CWellington CastilloChi62001
RFShin-Soo ChooTex41010
CFDelino DeShieldsTex10000
CFDustin FowlerOak10000
RFAvisail GarciaChi40000
1BJohn HicksDet21000
CFKevin KiermaierTB60001
3BFrancisco LindorCle10000
3B-SSManny MachadoBal51001
CRussell MartinTor00000
1BJoe MauerMin40010
LFWhit MerrifieldKC30000
SSMike MoustakasKC310212 RBI in Gm 3 win
P-DHShohei OhtaniLA10000
2BDustin PedroiaBos00000
PitchersIPHRERBBK
Gm 1Corey KluberCle231102
Gm 2Shohei OhtaniLAA321117
Gm 3Justin VerlanderHou320011Gm 3 win
Alex ClaudioTex474406Gm 1 loss
Dallas KeuchelHou310004
Craig KimbrelBos310004Gm 3 save
Mike LeakeSea341102Gm 2 loss
Andrew MillerCle431126Gm 3 hold
Chris SaleBos420014
PosAL All-Star Line-upTeamABHHRRBIRNotes
RFGerardo ParraCol56011Gm 2 GW SF in 12th
2BDJ LaMahieuCol45000
DHJoey VottoCin72111Gm 2 HR
1BCody BellingerLA51010
3BNolan ArenadoCol111000
CFMichael ConfortoNY41000
SSCorey SeagerLA50000
LFDavid PeraltaArz50000
CYadier MolinaStl80000
PosReservesTeamABHHRRBIRNotes
2B-3B-1BMatt CarpenterStl00000
1BFreddie FreemanAtl31000
2BScooter GennettCin71000
CFOdubel HerreraPhl2100112th in 2b, GW R Gm 2
CFEnder InciarteAtl41000
CFAndrew McCutchenSF70000
CFAJ PollockArz51001
CBuster PoseySF63020last 2 RBIs, rally short
1BAnthony RizzoChi21121
SSTrevor StoryCol53112
1BRyan ZimmermanWas43001
StartedAL PitchersTeamIPHRERBBKNotes
Gm 1Clayton KershawLA240001
Gm 2Chase AndersonMil310001
Gm 3Carlos MartinezStl321114Gm 3 Loss
Jake ArrietaPhl241004
Luis CastilloCin130000
Josh HaderMil110001
Brad HandSD200002
Kyle HendricksChi210002Gm 2 W, 11th-12th
Yoshihisa HiranoArz300024
Raisel IglesiasCin200011
Corey KnebelMil200005Gm 2 Win
Brandon MorrowChi332015Gm 2 Save
Hector NerisPhl133311G3 collapse
Jose UrenaMia000000
Felipe VazquezPit310002


The updates standings and final AL All-Star selections are now posted here.

(14 NL teams will play 14 AL teams WITH the DH after the games above, but Tampa Bay and St. Louis will be left out since they already played two interleague teams)

NL Standings

The NL went 55-41 in AL Statis-Pro games to date, which were all played with the pitchers batting. After the Oakland at St. Louis series, the next interleague series will all be played with the DH, but the following are the NL teams that did the best in my games against the AL. Keep in mind each NL team played it's games against one specific NL team, so some had touch challenges and some had easy challenges:

The official NL games are being played by my friend.

My friend does not use my quirky "game counts as 3-game series" system, so his records in the NL are straight up one statis pro game per game in the record. He took the top 8 teams as opposed to the whole league. He also played some interleague games with these 8 and even though he used the DH and I did not - seemingly giving the AL the advantage - the NL went 11-5 in those games which are part of the records below. While the AL seems to have the three best teams in actual MLB play, overall the leagues had actually split interleague games exactly 50-50 as of a few days ago. The Cubs are in 1st and if they met the 2nd best team in the league - Milwaukee - at this point, they would have only a 90 minute drive to Miller Park for way games. If they faced the third-place St. Louis Cardinals, they would have only a 4 1/2 hour drive to Busch Stadium.

National League Standings (does not include my AL interleague games)
Chicago          11-4
Milwaukee      10-5
St. Louis          9-6
Washington     7-8
Colorado         7-8
Los Angeles     6-9
New York        6-9
Arizona           6-9

Team Notes:
The Cubs establishing themselves.
Fewest runs allowed  (15gm/51 RA)
Best Run Differential  (15gm/  +19)

No surprise, most runs scored
Colorado  (15 gm/87 RS)
However, Home Runs
Milwaukee (15 gm/ 24 HR)
Colorado (15 gm/20 HR)

Obscure Stat of the Month
(I'm calling this a Statis-Pro Record)
The Dodgers lost to the Rockies 10-5,
and LA left 17 men on-base.  They had 13 hits
and a generous 9 walks from Colorado pitching.
So 5 runs scored and literally every other man was left out there!

All-Star Considerations


We will both figure out how to select our All-Star teams in the near future.

In the AL, I am also scoring MVP voting based on results. We play everyone without regarding for injuries or suspensions, and Cano and Judge are now tied for MVP with Indians starter Kluber.

Top All-Stars, MVPs MVP Points (top 3 players each game divide up 9 star points - max 5 for one player)
Judge NY 15
Cano Sea 13
Kluber Cle 13
Miller Cle 12
Verlander Hou 12
Beltre Tex 11
Merrifield KC 11
A Garcia Chi 10
Ohtani LA 10
Springer Hou 10
Correa Hou 9
Encarcacion Cl 9
Leake Sea 9
Mahtook Det 9
Moustakas KC 9
Sale Bos 9
Sanchez NY 9
Candelario Det 8
Castillo Chi 8
DeShields Tex 8
Duffy KC 8
Trout LA 8
Altuve Hou 7
Avilon Chi 7
Choo Tex 7
Faria TB 7
Keuchel Hou 7
Lindor Cle 7
Martinez Stl 7
Pedroia Bos 7
Benintendi Bos 6
Betts Bos 6
Brantley Cle 6
Cashner Bal 6
Cruz Sea 6
Davidson Chi 6
Fulmer Det 6
Joyce Oak 6
Kiermaier TB 6
Kimbrel Bos 6
Ozuna StL 6
Powell Oak 6
Sanchez Chi 6
Andrus Tex 5
Avila Ari 5
Bradley Bos 5
Castillo Cin 5
Cespades NYM 5
Chacin Mil 5
Contreras ChiC 5
Cozart LA 5
Cron TB 5
Desmond Col 5
Estrada Tor 5
Gattis Hou 5
Giolito Chi 5
Hicks NY 5
Martinez Det 5
Odorizzi TB 5
Pearce Tor 5
Perez KC 5
Richards LAA 5
Rizzo ChiC 5
Stroman Tor 5
Triggs Oak 5
Hiriano Ari 4 4
Andujar NY 4
Arrieta Ari 4
Barnhart Cin 4
Beckman Bal 4
Berrios Min 4
Bregman Hou 4
Cobb Bal 4
Deitrich Mia 4
Escobar KC 4
Field TB 4
Freeman Atl 4
Garcia Chi 4
Gibson Min 4
Goody Cle 4
Greinke Ari 4
Harrison Pitt 4
Healy Sea 4
Herrera KC 4
Incarte Atl 4
Junis TB 4
L Garcia Chi 4
Marisnick Hou 4
Martin Tor 4
McCutcheon SF 4
Olson Oak 4
Paxton Sea 4
Reed Mi 4
Roberts NY 4
Rosario Min 4
Sano Min 4
Santana Phi 4
Sequia Sea 4
Severino NY 4
Sotu... Was 4
Stanton NY 4
Allen Cle 3
Alonso Cle 3
Bauer Cle 3
Bour Mia 3
Buxton Min 3
Castro Bal 3
Chiranos Tex 3
Conforte NYM 3
Freese Pit 3
Gomes Cle 3
Gomez Tex 3
Gray NY 3
Gregorius NY 3
Gross Mi 3
Gurriel Hou 3
Haniger Sea 3
Happ Tor 3
Herrera Phi 3
Heyward ChiC 3
Hicks Det 3
Ianetta Col 3
Kershaw LAD 3
Mauer Min 3
Mengden Oak 3
Murphy Was 3
Nicasio Sea 3
Parker LA 3
Phelps Sea 3
Rivera LA 3
Sanchez Tor 3
Santana Min 3
Santiago Chi 3
Schebler Cin 3
Scherzer Was 3
Seager Sea 3
Shoemaker LA 3
Smoak Tor 3
Sucre TB 3
Trumbo Bal 3
Tulowitzke Tor 3
Upton LA 3
Votto Cin 3
Archer TB 2
Bleier Bal 2
Bonifacio KC 2
Britton Bal 2
Chapman Oak 2
Claudio TX 2
Cole Hou 2
Davis Oak 2
Delminico Chi 2
Donaldson Tor 2
Doolittle Was 2
Duda KC 2
Duffy TB 2
Gardner Phi 2
Giles Hou 2
Gonzalez Sea 2
Gordon KC 2
Hand SD 2
Harper Was 2
Kepler Cle 2
Lowrie Oak 2
Martin Det 2
McCann Atl 2
McCann Hou 2
Minor Tex 2
Moncado Chi 2
Moreland Bos 2
Morrison Min 2
Peacock Hou 2
Petit Oak 2
Piscotty Oak 2
Price Bos 2
Rasmus Bal 2
Reddick Hou 2
Schoe Bal 2
Tepera Tor 2
Urena Mia 2
Warren NY 2
Zimmer Cle 2
Anderson Chi 1
Anderson Mil 1
Beckham Mil 1
Bellinger LAD 1
Bruce NYM 1
Escobar Min 1
Grandal LAD 1
Green NY 1
Hechavarrio TB 1
Morales Tor 1
Parra Col 1
Posey SF 1
Ramirez Cle 1
Simmons LA 1
Store Col 1
Torres NY 1

Who is hot in the NL: 

David Peralta, Arz (19-39 .487) DJ LaMahieu, Col (19-47 .404) Matt Carpenter, Stl 5 HR Gerardo Parra, Col 11 RBI Anthony Rendon, Wsh 11 RBI Jose Martinez, Stl 11 Runs Scored Kyle Hendricks, Chi (3-0, 2.45) Who is not: Bryce Harper, Wsh (3-34, 0 HR, 0 RBI) Stephen Strasburg, Wsh (0-3, 4.75)

Update: We are adding rookie cards on a spreadsheet that lets you add any player you want in this google sheet. I based new cards on the MLB projected stats for the whole year, and going through rookie pitchers with more than 14 innings pitched Shane Carle of the Atlanta Braves is the only PB2-8 pitcher so far. I started the rookie batters just with their actual stats to get something on the page, and Houston has a Home Run 26-33, while the Yankees have 31-35 and 27-37 and Tampa Bay has a 42-43, but because the sample is small I will look at batters projections before actually playing with new rookies. This definitely makes the Yankees much stronger and the Astros and Rays a bit stronger than the rankings I have further down in this blog.

AL League Rules

Each game counts as a 3-game series. Winning team gets a 2-1 series win unless they win by at least 5 runs without extra innings, in which case they get a 3-0 sweep. Mathematically, it is just as hard to get a 5-run win as a sweep and run differential is a truer test in the short season.

Using 2017 Statis-Pro cards but current rosters. As long as someone is on the roster they can be used in a better role (eg a player with a better card from last year can play ahead of the player actually starting this year, or relievers who have better cards can be the closer. Also, relievers can be used to protect against a sweep (closer to hold a 5-run lead or keep a 4-run deficit from becoming a 5-run deficit.

Instructions for Playing Statis-Pro Baseball from MLB, to minors/youth/college to Japan (Ohtani vs. Suzuki)

We consolidated various sets of instructions on Statis-Pro Baseball game into the following.


Basic Understanding of the Game 1

What you need to play 2

1. Dice or Fast Action Cards. 2

2. Player Cards 2

How to Play the Game 3

Setting Up 4

Order of Play 4

2-12 number: 4

11-88 number - 11 possible results (hits, balks, Ks, Walks, HBP, WP, PB, Out) 4

Left vs. Right Adjustment 12/88, 88/11 or other. 5

If Result is OUT: 5

Chance of Error on Hit or Out 6

Once you determine a player who might make an error - E-0 to E-10 6

SR and RR - How Long Can a Pitcher Pitch Before Getting Tired? 10

Taking Extra Bases on Hits, Hit and Runs, or Bunts 11

Optional Advanced Rules 13

Clutch Batting (BD): 14

Clutch Fielding (CD or for catcher CD-C): 14

Z-Play - unusual plays, injuries and tough fielding plays: 14


Statis-Pro Baseball was invented by Jim Barnes in 1970, and in an interview he invited others to adopt and update the game as “open source.” Our free version enables you to either play current teams with projected players, or to choose from 60 all-time great baseball teams. There is a complete game and many seasons of great advanced Statis-Pro cards on the Statis Pro Advanced Facebook page, if you want to try the game here first and consider ordering from them if you determine you like it.

Basic Understanding of the Game


The unique aspect of the game is that each plate appearance starts by determining if the pitcher is in control of the at-bat and his card will be used, or if he “makes a mistake” to put the action on the batter’s card and give him a chance for an extra base hit. An initial roll of two-tradition 6-sided dice or a use of “fast action cards” yield a number of 2-12. The best pitchers keep it on their card on 2-9, while the worst pitchers only control the action on a 2-4. Once you know whether the batter or pitcher card will be used for that at bat, a subsequent roll of two 8-sided dice for a result of 11-88 or a similar number from the fast action card gives the result of the plate appearance.

What you need to play

  1. Dice or Fast Action Cards. 

You need one of the three things in these photos. If you choose to use dice, you need two traditional 6-sided dice, two 8-sided dice of different colors, and one 20-sided die. If you prefer to use the free fast action cards we provide, they look like the all-white card below. Others sell much nicer fast action cards, so google “statis-pro baseball fast action cards” and you can find a set for $10 - you can see the blue and green corner of one of those cards and they really do add to the game..


  1. Player Cards 

Next, choose the teams you want to play. If you want to play two of the 60 all-time great teams, print the pitchers (see 1995 Braves below) from this pdf (one team to a page) and then follow these directions to print out the batters (see 1927 Yankees below) from a google sheet. If you prefer to play modern players, then choose the pages of the teams you want from all 2022 Projected Batters (49 pages, 9 cards to a page) and All 2022 Projected Pitchers (62 pages, 9 cards to a page) - the cards will have ranges like the Scherzer vs. Betts cards below. So you will be using EITHER team sheets of players or individual cards of players.


How to Play the Game

Setting Up


Choose a player on each team to pitch and play the other 8 positions - C, 1B, 2B, 3B, SS, LF, CF and RF. Next choose if you will use an extra batter as a designated hitter (DH) or have pitchers hit in the game. Once you choose the 9 who will start the game, write them down in the order they will hit from 1st through 9th.


If you are using cards you can shuffle them, but if you printed out our free ones, you may just want to put them all in a big bowl to pull out the cards one at a time. Of course, if you are using the five dice then no shuffling is needed.


If you are using player cards, you can stack the line-up in order. If using team sheets, you may want to use a couple of business cards to put below each batter as they hit.


Order of Play


2-12 number:

Get a result of 2-12 from flipping a card or rolling the dice. If that number falls within the pitcher’s PB rating (pitcher or batter) then the action will occur on the pitcher’s card, and if outside that range it will occur on the batter’s card. The possible PB ranges on pitchers’ cards, from best to worst, are 2-9, 2-8, 2-7, 4-7, 2-6, 2-5 or 2-4.


If you choose to use optional advanced rules, look at the bottom of these rules for CD, BD or Z-plays, which can occur in place of the 2-12 number.


11-88 number - 11 possible results (hits, balks, Ks, Walks, HBP, WP, PB, Out)

On the 2nd card, read the second number (Random Number 11-88) to see what happens on that card, or look at the 8-sided dice for the 11-88 number.. (If noone is one base, change any BK, WP or CD on line 2 to an OUT).


Here are the 10 possible results:


1B = Single 

2B = Double (only on batters' cards)

3B = Triple (only on batters' cards)

HR = Home Run (only on batters' cards)

BK = Balk if anyone on base (only on pitchers' cards, if no one on base treat as OUT)

K = Strikeout 

W = Walk 

CD-C = Catcher Clutch Defense - if not using advanced rules treat as out

HPB = Hit by Pitched Ball (only on pitchers' cards)

WP/PB = Wild Pitch or Passed Ball  (only on pitchers' cards, if no one on base treat as OUT)

Out = see below.


If using player cards, the card will also indicate the fielder who gets the ball on a single (1Bf, 1B7, 1B8 or 1B9) or double (2B7, 2B8, 2B9). If using a sheet, the reading is simply 1B or 2B so use the second digit of the number to determine the field. A 1 or 2 (11, 12, 21, 22 etc.) indicates the batter pulled the ball, so a RN or RP hits it to LF, a SN, SP or P to CF and a LN or LP to right. If the last digit is 3 or 4, the hit goes to LF, 5 or 6 goes to CF and 7 or 8 goes to RF.


On old fast action cards, you would check after a WP or BK for a “yes” or “no” result, but skip that step even if using those old cards. If anyone is on base, the WP or BK occurs if it comes up on the card.

Left vs. Right Adjustment 12/88, 88/11 or other. 

The Cht numbers at the bottom right of the batter card indicates numbers on which results are adjusted based on if the opposing pitcher is right-handed or left-handed. The standard 12/88 for a left-handed batter indicates that an 11 or 12 is changed from a hit to a strikeout against a left handed pitcher, and an 88 is changed from an out to a single with runners advancing two bases against a right-handed batter. The standard right-handed batter has an 88/11 meaning an 88 against a left-handed pitcher is a single, runners advance two bases while an 11 is changed to a strikeout against a right-handed pitcher. Typically a switch-hitter is –/– meaning no adjustment.


For some batters there are more numbers impacted, for example a 14/85 would be the most extreme possible adjustment, and mean the batter struck out on 11-14 against lefties, and had singles with runners advancing 2 bases on 85-88. Just remember the number to the left of the dash is the adjustment against lefties, and the number to the right of the dash is the adjustment against righties. Further, the number either goes all the way down to 11, or all the way up to 85 from what is listed.

If Result is OUT:

If the result is an OUT, the fast action cards we provide will tell you what type of out is made.


If using the nice Fast Action Cards you produce then the following will tell you what happens to runners on base.


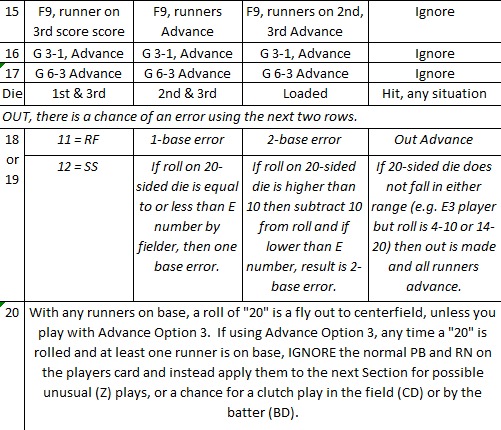
G6A (grounder to short) or any other A at the end of a grounder tells you the batter is out, but all runners advance.


Gx6 or any other reading with an x in the middle indicates runners hold and if there is a force out then the defense can throw out a forced runner. However, if runners are on 1st and 3rd then the defense must choose whether to take the out at second base and let the runner on third score or hold the runner at third and throw out the batter to leave runners on 2nd and 3rd.


G6 or any other reading with no x or A indicates a double play grounder if a runner is on 1st. However, if there is a runner on 3rd and no outs, the defense needs to either hold him and just throw the batter out at 1st, or let him score and turn the double play. If bases are loaded with no outs, the defense can choose to either throw the runner out at home, or take the double play from 2nd to 1st and let him score.


Chance of Error on Hit or Out

An error can occur under any of the three systems you can use for random numbers.


If using dice, any time a 18 or 19 on the 20-sided die is rolled there is a chance for an error. On a hit, the outfielder who fields the ball could make an error to allow an extra base on the hit, while on an Out the player could allow a 1- or 2-base error instead of an out.


On the nice Fast Action Cards you can buy from someone, a * will appear by the out result to let you know to check for errors on the next card. When using those cards, check for an error only on hits on the batter’s card - there is no chance of an error on a hit off the pitcher’s card.


If using the free fast action cards we provide, the Error Reading on the 4th card is only used if; there is a hit on the BATTER card on line 2 OR, there is a possible error (e?) on line 3 with an out. If the fielder's E number is in the range on this 4th line then everyone is safe in an out or gets an extra base on a hit. Flip for another 11-88 and if the number is 61-88 give batter and runners one additional base for a throwing error.


Once you determine a player who might make an error - E-0 to E-10

If there is a chance of an error on a player, then the next fast action card will determine if the error is in the player's range. A player can have anywhere from an E-0 (the best, never makes an error) to the worst E-10. If using the fast action cards, the next card will tell you if the error is in that range (e.g. Error 3-10 would be an error for an E-3 but not for an E-2).


If using dice, the 20-sided die determines the same thing with a roll of 3 meaning the same as a 3-10 range is an error. If the roll is 10 or higher, then subtract 10 but if it is an error then it is in the range. So a 13 die roll would be a 2-base error for an E-3, but no error at all for an E-2.


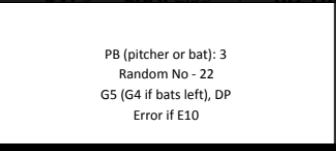
Obviously you cannot have a double play with noone on base, pardon the type under “1” with bases empty, just a grounder from shortstop to first base.


SR and RR - How Long Can a Pitcher Pitch Before Getting Tired?


The SR number is used for a starting pitcher, and RR used for a relief pitcher to see when they tire in a game.


For example, Greg Maddux on the sheet above would start at 15 or his SR.


This number is lowered by 1 every time the pitcher:


  1. Allows a runner to reach 1st base (unless on an error that is not his fault)

  2. Allows an earned run

  3. An inning ends while he is pitching (whether he started that inning, or cam in after it started)


Once a pitcher’s SR or RR is reduced to 0, his PB drops by 1, and then every additional education from one of those three occurs it is reduced by one more. If a pitcher started with the best rating of PB 2-9, then when he hit zero he would drop to PB 2-8, and then to 2-7, 4-7, 2-6, 2-5, 2-4, 2-3, 2-2 and if reduced further then the rest of the batters faced would skip the 2-12 number and automatically go to the 11-88 on the batter’s card.

Taking Extra Bases on Hits, Hit and Runs, or Bunts


Normally after getting the result you move onto the next batter. However, you can opt for any of the following strategies to advance base runners rather than going immediately to the next batter and the next 2-12 number.


Here are charts with various options. Note I have made some changes in writing after reviewing stats on frequencies of various scenarios. 


On bunts, we do have some all-time great players whose Sac (bunt) rating is AA+. The first time an AA+ player bunts in a game, use the AA column on the sacrifice chart BUT on an 11-28 he is safe at first base on a single. 


When a runner tries to take an extra base on a hit, the chart is used for the numbers on which he makes it to the next base. However, in some cases he cannot make it the extra base, but he is not thrown out either, he just sees a strong throw coming and stops at the base. He is only thrown if the 11-88 number for the throw is a 71-88 from a T-5 throwing arm for the outfielder, or a 75-88 for T-4, 81-88 for a T-3 and finally 85-88 for a T-2. Players advancing or being thrown out in modern baseball is even more rare, with layers taking the next base only 30 percent of the time and only being thrown out 1 percent of the time.


Optional Advanced Rules


You can choose to ignore a BD, CD or Z-play result to keep the game simple. If so, just ignore and play the 2-12 range to use the batter or pitcher card instead.


If you choose to play the advance rules, these can come up instead of the 2-12 number in the following ways.


If using dice, a roll of 20 on the 20-sided dice can overrule the 2-12 rating only if runners are on base.


If using fast action cards, in some cases a BD, CD or Z will come up instead of a 2-12 on some cards. With Fast Action Cards, Z-plays do happen even if noone is on base, but BD or CD is skipped if noone is on base.


Clutch Batting (BD):

If at least one runner is on base and the results is BD, or clutch batting, then the 11-88 number results in one of the following:


If the number would result in a 1B on the batters cards, then make the result is a 2B (double) and all runners on base score.


If the number would result in a 2B, 3B, HR or Deep on the batters card, then change to a home run.


If the number would have resulted in anything else on the batters card, then change to a foul ball, and the batter is still at the plate.


Clutch Fielding (CD or for catcher CD-C):

If the result is a CD-C then use the catcher's clutch defense rating from 1 to 5 but simply score as an Out if noone is on base. If a CD results and anyone is on base, then check to see which fielder has a chance to make a play. The fast action card will indicate which player, but if using dice then refer to the 2-12 number to determine the player.  If are using dice to determine which player has a chance for a clutch defensive player, or might commit and error - then use the following numbers:


2 or 3 = 1B, 4 = P, 5 = CF, 6 = 3B, 7 or 12 = SS, 8 = 2B, 9 - LF, 10 = C, 11 = RF.


Once you know the position, use that players CD rating of 1 to 5 then the 11-88 number on the chart below:


Z-Play - unusual plays, injuries and tough fielding plays

The following charts are used if an unusual “Z-Play” occurs. Draw a new 11-88 number.


2nd to home on 1b T2                            T3                           T4                           T5                        
OBR A11'-87 / out 8811'-77 / out 85-8811'-67 / out 83-8811'-57 / out 81-88
OBR B11'-77 / out 87-8811'-67 / out 85-8811'-57 / out 83-8811'-47 / out 81-88
OBR C11'-67 / out 87-8811'-57 / out 85-8811'-47 / out 83-8811'-37 / out 81-88
OBR D11'-57 / out 87-8811'-47 / out 85-8811'-37 / out 83-8811'-27 / out 81-88
OBR E11'-47 / out 87-8811'-37 / out 85-8811'-27 / out 83-8811'-17 / out 81-88
     
1st to home on 2bT2T3T4T5
OBR A11'-73 / out 87-8811'-63 / out 85-8811'-53 / out 83-8811'-43 / out 81-88
OBR B11'-63 / out 87-8811'-53 / out 85-8811'-43 / out 83-8811'-33 / out 81-88
OBR C11'-53 / out 87-8811'-43 / out 85-8811'-33 / out 83-8811'-23 / out 81-88
OBR D11'-43 / out 87-8811'-33 / out 85-8811'-23 / out 83-8811'-13 / out 81-88
OBR E11'-33 / out 87-8811'-23 / out 85-8811'-13 / out 83-88Cannot attempt
     
1st to 3B on 1B9T2T3T4T5
OBR A11'-73 / out 87-8811'-63 / out 85-8811'-53 / out 83-8811'-43 / out 81-88
OBR B11'-63 / out 87-8811'-53 / out 85-8811'-43 / out 83-8811'-33 / out 81-88
OBR C11'-53 / out 87-8811'-43 / out 85-8811'-33 / out 83-8811'-23 / out 81-88
OBR D11'-43 / out 87-8811'-33 / out 85-8811'-23 / out 83-8811'-13 / out 81-88
OBR E11'-33 / out 87-8811'-23 / out 85-8811'-13 / out 83-88Cannot attempt
     
1st to 3B on 1B8T2T3T4T5
OBR A11'-63 / out 87-8811'-53 / out 85-8811'-43 / out 83-8811'-33 / out 81-88
OBR B11'-53 / out 87-8811'-43 / out 85-8811'-33 / out 83-8811'-23 / out 81-88
OBR C11'-43 / out 87-8811'-33 / out 85-8811'-23 / out 83-8811'-13 / out 81-88
OBR D11'-33 / out 87-8811'-23 / out 85-8811'-13 / out 83-88Cannot attempt
OBR E11'-23 / out 87-8811'-13 / out 85-88Cannot attemptCannot attempt
     
1st to 3B on 1B7T2T3T4T5
OBR A11'-53 / out 87-8811'-43 / out 85-8811'-33 / out 83-8811'-23 / out 81-88
OBR B11'-43 / out 87-8811'-33 / out 85-8811'-23 / out 83-8811'-13 / out 81-88
OBR C11'-33 / out 87-8811'-23 / out 85-8811'-13 / out 83-88Cannot attempt
OBR D11'-23 / out 87-8811'-13 / out 85-88Cannot attemptCannot attempt
OBR E11'-13 / out 87-88Cannot attemptCannot attemptCannot attempt


Decide before the game if you want these optional adjustments to the ranges above.


Optional AdjustmentsUse 1st that appliesif 0 or 1 outsif 2 outs
Regular Hitany odd number RNSameadd 20
Texas Leaguercan divide RN by 12add 40add 60
Bloopcan divide RN by 4add 20add 40
Line Drivecan divide RN by 2subtract 20Same

The numbers above are based on these numbers.
   
Random Number 11-88                1st to 3rd on 1B2nd to home on single1st to home on double
Advances Extra Base11-3311-5711-43
Only advances same as hitter34-8758-8544-86
Out trying to Advance8886-8887-88
    
Based on actual occurances through 7/4  1st to 3rd on 1B2nd to home on single1st to home on double
Advances Extra Base252428871062
Only advances same as hitter569117071420
Out trying to Advance10919162

Below are the Clutch Defensive Charts so you have them in one place.

C-CD (Catcher)CD1      CD2      CD3      CD4    CD5
Foul Out11'-1812'-1811'-3811'-4811'-58
Passed Ball21-5831-5841-5851-5861-64
Infield single61-8861-7861-6861-6465-66
Lead runner out 81-8871-8865-8867-88
      
1st Base & 3rd BaseCD1CD2CD3CD4CD5
Line Out, Lead Runner Doubled off11'-1811'-2811'-3811'-4811'-58
Grounder, lead runner thrown out even if no force21-2831-4841-5851-6861-78
Line Drive single, advance 2 bases31-5851-6861-7871-8481-88
Double down line, runners score61-8871-8881-8885-88 
      
Shortstop, 2nd Base or PitcherCD1CD2CD3CD4CD5
Line Out, Lead Runner Doubled off11'-1828-Nov11'-3811'-4811'-58
Grounder, lead runner thrown out even if no force21-2831-4841-5851-6851-78
Hard Grounder through for Single, runners advance 2 bases31-8851-8861-6871-8881-88
      
OutfielderCD1CD2CD3CD4CD5
Line Out, Lead Runner Doubled offNoneNone11'-1411'-1811'-24
Nice catch of line drive, runners hold11'-1811'-2815-3821-4825-48
Nice catch of deep drive, runner on 2nd and/or 3rd advance21-2831-4841-5851-6851-78
Line drive single, advance 1 base31-5851-6861-7871-8481-88
Line drive double, runners score61-7871-8281-8685-88 
Line drive triple81-8883-8887-88 


Here is the updated Steal Chart.

 
Results (not odd RN never out stealing, worst case holds)                       Steal 2b     Steal 3b
Steal unless SP: E11'-1411'-14
Steal if AAA, AA, A, B or C15-2315-17
Steal if AAA, AA, A or B24-3218-28
Steal if AAA, AA or A33-4631-38
Runner Out Stealing (odd number holds)47-5241-52
Runner Out if Catcher TA or TB (steal if TC, if out on odd RN holds)53-5653-55
Runner Out if Catcher TA (steal if TB or TC, if out on odd RN holds)57-6356-61
Holds, cannot get break64-6862-67
TA picks off catcher, otherwise hold71-7168-68
TA or TB picks off catcher, otherwise hold72-7271-71
Steal if AAA or AA73-7872-76
Steal if AAA81-8877-82
Runner Holds 83-88


Here are the Z-Plays so you have all in one place.