Sunday, January 15, 2023

Calculated Value Add Basketball Game Cards - 2nd of 2 Posts

The 136th team has been added to the Value Add Basketball Game cards. If you click on that link, you can print page 111 to get the Stephen F. Austin cards without having to scroll through the 136 pages - one team to a page.

In the previous blog we walked through the calculations to create the offensive ranges on the card. In this blog we cover Steps 6 though 13 for creating your own teams, and in this case we completed all steps to create our 136th All-Time Great team, the 14-seed Stephen F. Austin team that in 2016 blew out 3-seed West Virginia behind 33 points by Thomas Walkup. It was the 13th MVP in 15 games according to www.kenpom.com, and Walkup & SFA already upset 5-seed VCU in March Madness, and would have gone to the Sweet 16 but for a desperation tap by Notre Dame in the next game.

The cards below have been added as the 136th team, and to invent any new team you want, you can first review the previous blog on how to make your own cards.You can then use steps 6 to 13 below to create any other new team you would like to add. 


Steps 1-5 on the previous blog cover the parts of the cards above already calculated. The following steps fill in the rest of the information.

Step 6. Add Points Per Game or Value Add Ranking in Line 2. While not a necessary step, I like to add the points per game for players from the last Century, or the Value Add Basketball Ranking for each player to give a quick reference for the top players. In this case I click on https://valueaddbasketball.com/ballall.html and search by Stephen F. Austin and 2016 and get this sheet.


This is also a nice double check on our line-ups, and in this case I noticed that we calculated Clide Geffrard as the 2nd best player on the team behind Walkup, while I had slated him as the back-up Power Forward. When I looked closer, he did play 62% of the minutes so has great endurance, but he did start only two of 30 games - so he was the incredible 6th man in games. I left him at "back-up" Power Forward, but when playing the game you can use a player where ever you want and either as a sub or starter - just use Stamina to make sure they don't play too much.

Because there are more than 4,000 players every year, we list a player near the top 40 as "top 1%" of players, then close to the top 200 is top "5%,", close to the top 400 is "top 10%," etc. On the cards based on their Value Add we added to the card:

Walkup 1st/MVP

Geffrard top 10%

Floyd top 15%

Charles top 25%

Holyfield top 30%

Johnson top 50%

Then we don't list anyone for the others, as they are not in the top 50%.

Stats for National AdjO, TO%, Blk% and Stl% for Final Steps

For the final steps, you will need to scroll up to the top of the team sheet to record the national averages circled below. In 2016, the national AdjO = 104.8, Turnover% = 18.1, Block% = 9.2 and Steal% = 8.6.


Step 7. Calculating Steals on the Card. Steals occur on 11-16 or 31 on the 11-66 dice rolls. To determine the player's steal% (4.0 for Walkup) by 15 (60 for Walkup) and divide by the league team Steal % (8.6 in 2016) so that equals 6.97 for Walkup. This rounds to 7 steal numbers for an 11-17 steals on Walkup's card. Keep in mind a guard always has the option of a fast break off a steal, a forward has the option if the roll was odd numbers (11,13,15,31) and a center can never start a fast break off a steal.


If you want the more detailed reverse engineering -

To calculate each players steal range, you start by finding the average steal rate that season, which was 8.6, and divide that by 5 players to get the average steal percentage per player that year of 1.72. Therefore a exactly average player with a 1.72 Steal% will steal the ball on half the main range - a roll of 11-13 when the player he is guarding has the ball.

You divide that by 3 to get 0.57, meaning a player should get one steal for every 0.57. Therefore that calculates to this table, which is pretty close to what you will have most years. Here are the ranges and the number of steals we add to each player on the Stephen F. Austin players, who had the 5th highest overall steal teams with Walkup stealing on 11-16 (the 11-17 is a little better for advanced games) and three other players stealing the ball on five of the six steal numbers of 11-15 (Charles, Floyd and Pinkey).

1 steal for everyBottom RangeTop RangeSteals 11-Stephen F. Austin Steal Ranges
0.5700.28No Steals 
0.570.290.8511-11'Cameron 0.1
0.570.861.4211-12'Williams 0.9
0.571.431.9911-13'Holyfield 1.7, Johnson 1.4, Bain 1.7
0.5722.5611-14'Geffrard 2.4
0.572.573.1311-15'Charles 3.0, Floyd 2.7, Pinkey 3.1
0.573.143.711-16' 
0.573.714.2711-17'Walkup 4.0
0.574.284.8411-18' 
0.574.855.4111-19' 
0.575.42or higher11-20'A player with this steals 31 on all cards

Steal 8. Calculate Blocks on card. The math is the same basic math. In this case TJ Holyfield blocks 8.3% of all 2-point shots while he is on the courts almost as many as the average team (9.2) in 2016, so he calculates with more than the max 10 block shot numbers.


Here is how the equation calculates for all players in the order the cards will be printed.

PlayerBlk%Card BlocksHt
Trey Pinkney0.10.25'9
Demetrious Floyd0.50.85'11
Thomas Walkup1.93.16'4
Ty Charles1.52.46'5
TJ Holyfield8.313.56'8
Jared Johnson00.05'0
Dallas Cameron0.40.76'3
Nathan Bain4.26.86'6
Clide Geffrard23.36'5
CJ Williams0.40.76'7

The block range is 21-26 on the card and can go up to 21-30 on the card, which like steals, really means 21-26 blocked shot on the player he is guarding, and then on a 32 roll he blocks the shot no matter which of the five opposing players has the ball. Since Holyfield's 13.5 is will behind the maximum 10, he gets a 21-30 on his card and blocks a shot any time a 32 is rolled, no matter who the ball went to on the other team.

Therefore Pinkney has a "None" by his blocks because 0.2 rounds down to 0, Floyd blocks only on 21 since 0.8 rounds up, Walkup blocks on 21-23 for his 31. etc.

Steal 9. Fouls. The FC/40 factor, fouls charged on a player per 40 minutes, translate onto a straight table for how many fouls are charge to him in the 33-36 defensive foul range.

FC/40 bottom rangeFC/40 top rangeFouls on card
02No fouls
2.01336
3.01435-36
4.01534-36
5.01higher33-36
 
Here are the actual ranges based on the SFA 2016 players. Three players committed a lot of fouls, and thus have the highest 33-36 range. Keep in mind half the fouls charged are from the offensive player that the defender is guarding.

PlayerFC/40     Card Fouls
Trey Pinkney3.435-36
Demetrious Floyd    2.336-36
Thomas Walkup3.835-36
Ty Charles4.534-36
TJ Holyfield6.933-36
Jared Johnson5.533-36
Dallas Cameron3.535-36
Nathan Bain3.635-36
Clide Geffrard4.035-36
CJ Williams6.233-36

Steal 10. Turnovers. The same basic math works with the turnovers, since half of all turnovers committee by a team result from the defensive card steals against him. The turnovers on these cards are dead ball turnovers (thrown out of bounds, traveling, etc.) - unlike steals the do not result in a potential fast break. 

Start by looking up the TORate for the entire league. There is no need to divide by 5, because the League Average and Player Average are both the percent time the ball is turned over.

Floyd was the best at protecting the ball on SFA 2016. Here is the equation to run:

Players Turnover Rate (10.6 for Floyd) MINUS half of the league TORate (17.7 is the league average so use 8.85 in this part of the question) and for Floyd that equals 1.75 for Floyd. This number is then divided by 3 (leaving 0.6 for Floyd) which barely rounds up to 1 turnover. Since the turnover range starts at 41 you then just add 40 to that number (to get 40.6 for Floyd) which just misses a "None" on turnovers, but does round up to a 41 to make 41-41 as a range. Williams had the most turnovers on the team, calculating to a 41-47, but the highest range is 41-46 so that is his range. Here are the turnover ranges for each SFA 2016 team.

PlayerTORateHalf Lgminusdiv 3 + 40Card
Trey Pinkney22.08.8513.1544.441-44
Demetrious Floyd10.68.851.7540.641-41
Thomas Walkup12.08.853.1541.141-41
Ty Charles19.58.8510.6543.641-44
TJ Holyfield27.18.8518.2546.141-46
Jared Johnson17.28.858.3542.841-43
Dallas Cameron14.98.856.0542.041-42
Nathan Bain20.38.8511.4543.841-44
Clide Geffrard15.98.857.0542.441-42
CJ Williams29.88.8520.9547.041-46
League Average17.78.858.8543.041-43

Step 11. Determine Stamina of each player - how many of 44 possessions he can play before losing effectiveness. 

The formula for Stamina uses the players Min% (percent of minutes played)

Stamina = (Min% x 0.66) – 11

Here is the calculation for each SFA 2016 player.

Player%Minx .66 - 11Optional list possessions
Trey Pinkney67.845PG 44-1
Demetrious Floyd61.841SG 41-1
Thomas Walkup75.250SF 44-1
Ty Charles62.341PF 44-42, 38-1?
TJ Holyfield50.233C 44-38, then 25-23 then ?
Jared Johnson28.719if 3-pts needed
Dallas Cameron42.528 
Nathan Bain11.27 
Clide Geffrard62.641SG 44-41, PF 40-38, C 37-27 then 24-1?
CJ Williams21.414

An option at this stage is to not only enter the Stamina number, but go ahead and try to figure out the rotation of players you would typically use in the game. 

When looking over SFA's 2016 staminas, there is plenty of stamina on the team so I would use a 6- to 7-man rotation and probably not put Cameron, Bain or Williams in the game unless there is foul trouble.

As noted above, Geffrard only started two games but was actually the second most valuable on the team. While Pinkney and Walkup can play all 44 possessions (44-1 in the notes) both Floyd and Charles need to sit out just 3 possessions with their 41 Stamina. Therefore I have Geffrard play the first three possessions in place of the SG (he isn't really playing the SG position, but it's easier to note that way on who he is replacing from the starting line). Then he plays the next three possessions (40-38) in place of the Power Forward. 

Since Holyfield at center is a 33 he needs to rest at least 11 possessions, I put Geffrard in for the Center for those 11 possessions from 37-27. Geffrard then needs to sit 3 possessions, so I have him sit possessions 26, 25 and 24 with Holyfield in his place.

At that point, we have possessions 23 - 1 (the end of the game) to play and Geffrard and Holyfield both have Stamina to play the game. We calculate Geffrard as the higher ranged player so we may leave him in the rest of the game - but as noted above, Holyfield is the great defensive shot blocker so we might want him to protect the lead - so we may decide based on the game situation.

At very least, these six players will play every game. The other player I see who I might use in certain situations is the backup point guard Jared Johnson, who is the deadliest 3-point shooter on the team with a 1-6 range on the 20-sided die of making a 3-point shot. He could be key to a late rally if behind of even just needing a 3-point shot down 3 at the end.

None of these rotations are required, they are just suggestions when you pull out a team for the first time. The only key is not to have a player still on the court after their Stamina runs out, because then they are tired and every die roll of any kind is adjusted one against them in whatever direction hurts them.

Step 12. Determine the Offensive and Defensive Rebound Range of each player.

Walkup was the best rebounder on the team, just edging Holyfield. The formulas to determine if a player grabs a rebound he has a chance to get on the Rebound Chart and a 1-6 roll, is as follows:

Take the players Offensive Rebound % (Walkup 9.2 OR%) and multiply by 0.5, then add 1.2 and the rounded number for Walkup is 6, meaning he gets the offensive rebound on any of the rolls of 1-6 if the 20-sided die gives him the chance at the rebound after SFA misses a shot. Note that while that is the whole range, players can have a higher range which lets them get rebounds when the game calls for the highest rebound number in the game. For example, Purdue's center this year - Zach Eddy - had a 20.7 OR% which gives him a 1-12.

The Defensive Rebound % (Walkup 18.6) is multiplied by a lower number, 0.25 (leaving 4.65 for Walkup) and then you subtract 1.2 and round (leaving 3 for Walkup).

Therefore Walkup gets a 1-6 for Offensive Rebounds (excellent) and a 1-3 for Defensive Rebounds (average). As a whole SFA was a very good offensive rebounding team but overall pretty weak defensive rebounding team. Here is the same calculation for each player on the team and what will end up on their car.

In my notes on rotation of players above I did not include Williams, but looking at these calculations he is the only good defensive rebounder on the team, so if that became an issue against a certain team it might make sense to sub him into to the game.

Player                       OR%  *.5      Card+1.2     DR%    *.25      Card-1.2
Trey Pinkney1.50.751-26.81.71-1
Demetrious Floyd1.50.751-26.81.71-1
Thomas Walkup9.24.61-618.64.651-3
Ty Charles7.33.651-513.93.4751-2
TJ Holyfield8.84.41-617.24.31-3
Jared Johnson2.81.41-36.51.625None
Dallas Cameron2.91.451-33.90.975None
Nathan Bain7.23.61-5225.51-4
Clide Geffrard9.84.91-6184.51-3
CJ Williams7.13.551-525.16.2751-5

At this stage, the cards have been filled into this level:


Step 13. At this stage the cards are set except for the last piece - the crucial dunk range.

The cards would be accurate at this stage if all teams played roughly the same Strength of Schedule, like in a professional league. This is not true in the game, where most teams played against a very high level of competition in one of the Power 6 conferences or a High Mid-Major, in addition to several elite March Madness opponents. 

However, playing in the Southland Conference, SFA faced a much lower level of competition, and the Dunk Range is the adjustment for that. The two key www.kenpon.com stats that measure that are the opponent's OppO (how tough were the opposing offenses) and OppD (who tough were the opposing defenses). In 2016, the average AdjO (points per 100 possessions) was a very high 104.8. However, SFA's competition most of the year was not Elite like most teams in the game, and in fact was well below average as show by their numbers.


SFA faced only the 251st best opposing offenses (average 102.7 points per a hundred trips, two points less than the league average of 104.8.

SFA faced only the 321st best defenses in the country (average allowing 108.6 points per 100 trips adjusted for their competition, so 3.8 points more than the average team would allow).

If a team played average opponents all year (104.8 AdjO and AdjD) then their dunk range would calculated as three dunk numbers (51-53) and a balanced defensive number of +0 that did not either add or subtract from the opponent's dunk range.

Here is the basic calculation for the two figures for each team:
 
Calculations for team's Offensive Dunk RangeSFA Tally
Opp AdjD (Opponents Adjusted Defense)108.6
League Average Adj0 that season - 104.8 in 2016104.8
Subtract League Average from Opp AdjD3.8
Multiply by 0.720.72
equals what an average offense should score against defenses they faced2.736
The Final Dunk Range numbers is 3 minus number above (3 - 2.24 rounds to 1)0.264
The Dunk Range starts at 51, but with SFA having 0 dunks is calculates as 51-5051-50
Calculations for team's Defensive Adjustment to Opponents Dunk RangeSFA Tally
Opp AdjO (Opponents Adjusted Offense)102.7
League Average Adj0 that season - 104.8 in 2016104.8
Subtract Opp AdjO from League Average2.1
Multiply by 0.720.72
equals +31.512
Add or Subtract Rounded Figure Above as Adjustment to Opponents Dunk+2

There is an alternate method of plugging numbers into this google sheet to calculate both.

With these 13 steps complete, the following is the 136th team in our Value Add Basketball Game Great Teams set - the 2016 Stephen F. Austin team.


How to Make Your Own Value Add Basketball Cards - Our 136th Team

Some of the 63,700 who have visited our Value Add Basketball Game ask about creating new teams. We created the 2020 anticipated NCAA and NIT teams to play the Covid cancelled tournament, in addition to the 135 All-Time Great teams. 

One reader is working on an automated calculation of cards, though it is complicated, so after giving him the script we decided to also post this blog in case you want to manually go through to create one of your favorite teams. The process for teams before the start of the www.kenpom.com era (2002 to present) is simply too complicated to script, so the following process works only for seasons since then.

You first need to access the team you want to create at www.kenpom.com. We've tried to pick the best combos of top players and top teams - but also as often as possible create one for a university that does not yet have a team in the game. We actually meant to create 136 all-time great teams and accidentally did 135 in the first place, so our new 136th team is a new University - the greatest 3-year Cinderella run of the Century led by the only player from a small conference to be the best player in the entire country - Thomas Walkup and Stephen F Austin.

1. Pick you team from 2002 - present: Thomas Walkup and Stephen Austin 2016. Value Add Basketball calculates that the best player in all 21 seasons were from a Power 6 Conference or very high major conference (ACC 4, American 1, Big Ten 4, Big 12 3, Big East 1, CUSA 1, MWC 2, Pac-12 2, SEC 2) except one. In 2016 Thomas Walkup of Stephen F. Austin calculated as the best player in the country.

Not only was Walkup the best player in 2016, he was in the best 1% of all players in 2015 and top 5% of all players in 2014, the greatest 3-year span of a Cinderella team this Century. During that 3-year tenure of current Illinois coach Brad Underwood, Stephen F. Austin went 89-12. In 2014 they stunned VCU in the NCAA tournament, then Walkup scored 22 and grabbed 11 rebounds in a 2nd round loss to UCLA. In 2015, the lost a defensive battle in the opening round to the other team we considered for this 136th team - the Utah team that featured Value Add's best player in the nation for 2015 - Delon Wright. 

Anyone who doubted if our ranking of 2016 with Walkup as the most valuable player in the country should look at the 2016 tournament. Walkup scored 33 points, and added 9 rebounds, 4 assists and 4 steals in a stunning upset blowout of West Virginia 70-56, then added 21 points despite missing most of the second half in foul trouble as only a desperation tip-in by Notre Dame eliminated SFA 76-75.

And so we present the greatest 3-year Cinderella team of the Century as our 136th Great All-Time team.

2. Get the team's stats from www.kenpom.com and calculate their dunk total. 


Once you pick your team, find that team at www.kenpom.com. You can see the page above for the first step, then need a $20/year subscription to access the rest of the team data. Under Strength of Schedule record the team's OppO and OppD for calculating the Dunk range in the final Step 13.

Then click on the team to pull up the team sheet and scroll to the bottom to see these player stats. You will need the stats that are circled for the top 10 players. The bottom chart just tells you the best position for each player.


Copy and paste the stats for the top 10 players in the top section above into an excel spreadsheet. Note any shooting ranges that starts with a 1 through 12 will show up as a month when you paste, so just us an extra mark to convert it. Here is what is pasted from the Stephen F. Austin 2016 page. 


The column I added to the right is which position each player will play. I use the depth chart Ken Pomeroy provides at the bottom, so when I see Trey Pinkney played point guard 77% of the time, I put a "1" by his line to show he is the starting point guard. The numbers 6-10 I used for backups, so after entering 1 through 5 by players, I put a "6" by Jared Johnson as the backup point card. This is important because it is the order in which the players will appear on the team sheet. Remember, teams are limited to 10 players, so in this cards the players with the lowest percent of minutes played will not be in the game, Jovan Grujic (8% of minutes played), Lasani Johnson (4.6%) and LaQuan Smith (3.7%) will not have player cards.

I also noted in bold or font color what columns we will use to calculate the cards. The other columns are not used and will be eliminated.

3. Delete the columns you do not need. At this point we delete the columns we don't need as well as those players who will not have one of the 10 player cards We also take the columns in red out to the right and convert and rearrange them slightly into 2-pointers and 3-pointers missed instead of attempted, and we divided free throw attempts by 2 for a new figure. After those changes, here is the condensed part of Pomeroy's stats we need to keep.

4. Run the calculations for what happens on the 1-20 die when the player tries to score. We can now calculated what happens based on the 20-sided die once a player gets the ball and he tries to score. 


To jump ahead to the easy part, if a player gets to the free throw line you roll the 20-sided dice and the range is based on the rounded free throw percentage. Walkup hit 83% of his free throws, so we multiply that figure by 20 to get "17," meaning he will make a free throw on 1-17 and miss it on 18-20.

Now to the 20-sided roll before that, when the player first gets the ball and tries to score. In Walkup's case he made 9 three-pointers, 187 two-pointers, he attempted 190 free throws and half of that is roughly 95 trips to the line, he missed 28 three-pointers and he missed 111 two-pointers. Add those together, and he tried to score 430 times. Therefore we divided each of those five numbers by 430, then multiply by 20 to determine how often each thing should happen each time the 20-sided roll comes to him to try to score.

The calculations you see after the "430" figure on that top line create this part of the card.

Thomas Walkup

3-pt made: None (0.4 per 20 rounds down to zero)

2-pt made: 1-9 (8.7 rounds up to 9, so he gets nine numbers with a made 2-pointers)

2 Free Throws: 10-14 (4.4 would round down to 4 BUT we actually add the numbers up to that point, so 0.4 plus 8.7 plus 4.4 = 14 so the Foul drawn number actually goes up to 14 rather than 13 or this 10-14 range).

3-pt missed: 15 (1.3 rounds down to 1)

2-pt missed: 16-20 (5.2 rounds down to five numbers and when you add the 5 calculations they do add up to 20.0, which is a double check that the formulas are all accurate). 

FT Made: 1-17 (as mentioned above, the .83 free throw percentage times 20.

As you can see, a deadly combination of drawing a foul on 10-14 and then hitting the subsequent two free throws on rolls of 11-17 show some of the reason he dominated in 2016.

5. Look at % Possessions to determine who gets the ball. Before you use that 20-sided die roll, you need to figure out who gets the ball on each possession. The 8-sided die determines his. Each player gets the ball on 1 of the first 5 numbers, so if the 5 starters were in, based on the left column, a roll of 1 goes to the PG Trey Pinkney, a 2 goes to the SG Demetrious Floyd, a 3 goes to the SF Walkup, the 4 goes to the PF Ty Charles and finally a 5 goes to the C TJ Holyfield.

This leaves the determination of who gets the ball on a 6, 7 or 8. Once in a while a player has a % possession of higher then 33%, and if that were the case then the player would get the ball on two of the three extra rolls, so if Walkup were that high, then by the "Gets Ball On: you would type 3, 6 & 8." 

Since no player is above 33%, we instead take the three starters with the highest possession percentage get the ball on an extra number, so the Get Ball On comes to:

1 - Trey Pinkney (only 8.1% of possessions, so definitely the fewest possessions and only his one number as point guard.

2 & 6 - Demetrious Floyd (21.5% is second highest)

3 & 7 - Thomas Walkup (27.3% is highest)

4 & 8 - Ty Charles (21.1%)

5 - TJ Holyfield (20.3%).

You then to the same thing with the five subs, so 1 & 6 = Jared Johnson, 2 - Dallas Cameron, 3 = Nathan Bane, 4 & 7 - Clide Geffrard, 5 & 8 = CJ Williams. Often a mixture of starters and reserves are in the game. In that case, if you have too many 6-7-8 on players cards you simply choose which three will get on of the extra rolls, and if you do not have all 6-7-8 numbers come up, then if that number comes up then no one gets the ball and you roll a second time, but if any of the three (6, 7 or 8) come up then it is a shot clock violation and the other team gets the ball on a turnover.

Those are the five steps to calculate the offensive numbers on each card. The next blog will calculte the defensive numbers and rebounding on each card.

Saturday, January 7, 2023

Best 25 College Basketball Teams on the Road

Look for the feature story on the CBS Sports Site Dodds on Sports that will run down the top road teams in the country.


This blog is a link for anyone who wants to look further down the list of the best road teams this year, or for the fellow stat geeks who want to read the way kenpom calculations are made - below these lists.
 
RnkTop 25 Road WarriorsSoS         WinsLoss  MarginAway kenpom
1Kansas20.33015.0              35.3
2Houston13.33019.032.3
3UCLA14.04016.830.8
4Alabama19.0309.028.0
5Tennessee12.72114.026.7
6UConn18.8225.324.0
7Oklahoma St.16.8226.823.5
8Rutgers24.712-2.322.3
9Marquette17.6323.621.2
10West Virginia16.2234.020.2
11Providence11.8418.019.8
12Kansas St.16.5223.019.5
13Purdue14.3305.019.3
14San Diego St.10.7308.719.3
15Wisconsin20.721-1.319.3
16Creighton27.703-8.319.3
17Gonzaga16.3414.419.2
18Xavier11.5407.318.8
19Virginia15.0223.818.8
20Missouri18.0210.018.0
21Penn St.18.712-0.718.0
22Seton Hall23.024-6.316.7
23Utah St.5.73010.716.3
24New Mexico10.5315.516.0
25Auburn12.3122.715.0
       
RnkOthers QualifiedSoSWinsLossMarginAway kenpom
26Indiana24.013-9.314.8
27Memphis16.513-1.814.8
28Iowa St.19.321-4.714.7
29Clemson10.5313.814.3
30Utah10.8313.314.0
31FL Atlantic5.4417.613.0
32Sam Houston St.11.3531.112.4
33North Carolina15.813-3.512.3
34Washington St.14.917-6.18.8
35Nebraska17.224-9.57.7
36Va Tech10.003-3.07.0
37Kentucky24.703-18.76.0
38Weber St.8.925-5.43.4
39Southern Illinois4.544-1.43.1
40Colorado St.16.214-13.23.0
41Duke12.312-11.31.0
42Northwestern St.6.845-8.9-2.1
       
RnkOnly 1 or 2 road gamesSoSWinsLossMarginAway kenpom
 Texas20.5205.526.0
 Saint Mary's24.511-1.023.5
 Ohio St.19.5113.523.0
 TCU20.0202.522.5
 Oklahoma18.002-0.517.5
 Arizona17.511-3.014.5
 Texas Tech20.001-6.014.0
 Arkansas17.511-8.09.5
 Illinois18.002-9.09.0
 Baylor22.502-20.52.0

These would be the standings (give or take a rounding error) if teams were rated using Ken Pomeroy's method but only based on the road games they played this year. Too often a team looks really dominant at home in a few early games, and then cannot handle hostile crowds. On the flip side, the teams that can handle the pressure of a hostile crowd seem more likely to handle the pressure of March Madness.

The 42 teams we did calculated fit one of two categories:

1. One of the 30 teams who were both in the overall www.kenpom.com Top 40 AND played at least three road games, or

2. One of the 12 teams who are not in www.kenpom.com top 40 but have won a road game at a Top 40 team AND have played at least three road games.

It is very unlikely any other teams we did not calculate would be in the Top 20.

There are 10 teams who are in the top 40 at www.kenpom.com but have NOT played three road games yet, so we list them at the bottom. The Texas Longhorns ranking of 26.0 in the bottom set of teams would rank them 6th in our road Top 25, but based on only two games we want to wait until they get their tough road tests in Big 12 player shortly.

How we simulated KenPom's rankings:

SoS - the strength of schedule is the average www.kenpom.com AdjME for the team's road games today rounded to the nearest number. The number on this table is then increased by +4 to give credit for the four point edge to the home team opponent, and we did include "semi-road" games but in that case only two points were added to the SoS.

For example, our #1 road team Kansas played road games at Missouri, West Virginia and Texas Tech, and those three teams average a 16.3 AdjEM at www.kenpom.com. However, because these are all true road games, we add +4 to each and the average comes out to 20.3. 

Not only did Kansas beat all three, but they averaged beating them by 15.0 points, so the kenpom system adds the SoS and the margin of the scores, and together the www.kenpom.com rating if only road games were counted would be 35.3 - making Kansas the best team in the country in this small sample.


Sunday, December 25, 2022

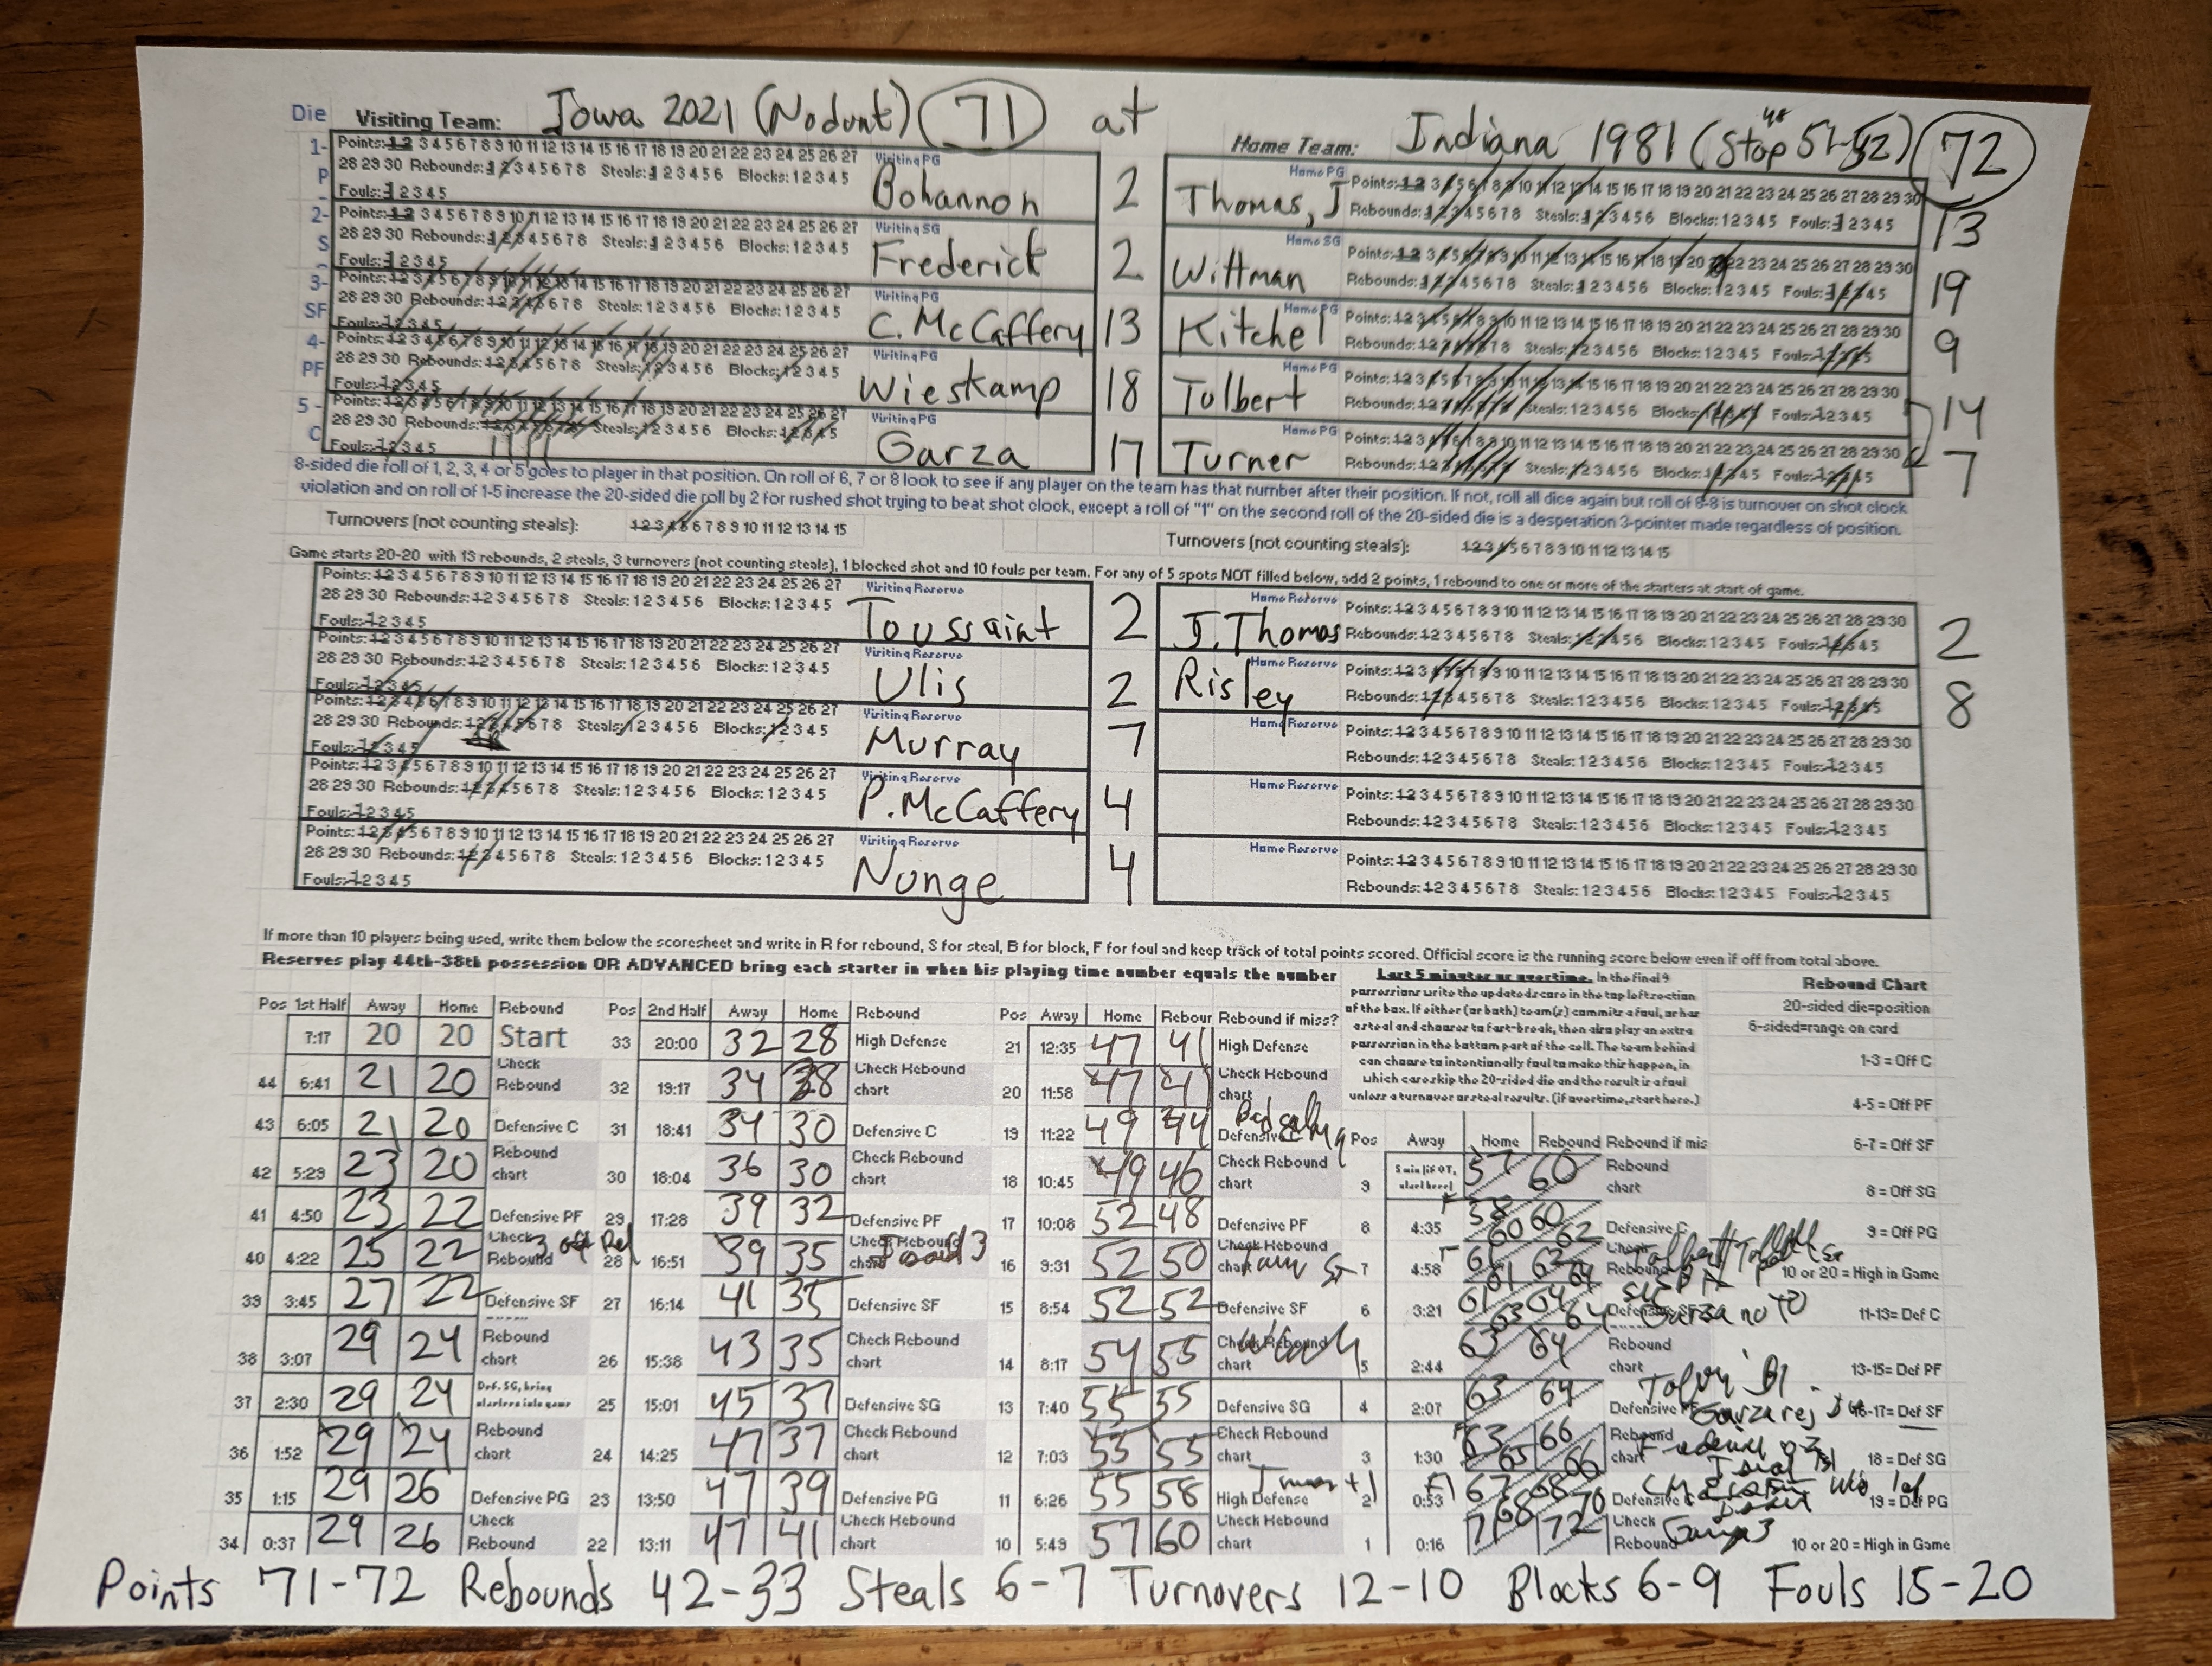
Isaiah Thomas' Indiana Rallies Past Garza's Iowa 72-71

 Randy Wittman's buzzer beating shot delivered a 72-71 win after Luka Garza's 3-pointer seconds earlier gave Iowa the lead. We already did a full preview of the game with tips on setting up the Value Add Basketball Game on this past blog, so here are some strategy tips and highlights.

Iowa dominated the front line while Luka Garza was joined by Keegan Murray and Jack Nunge, who all have the top block range (21-30, meaning they block shots on a 21-26 when the player they are guarding as the ball, but also can all block a shot on a 32 no matter which opposing player has the ball). The offensive rebounding range while all three are on the court is an incredible offensive 1-10, 1-9 and 1-15.

They set the ton early on the 40th to last possession (4:22 in the first half) when all three grabbed an offensive rebound before Murray scored. They led 43-35 when the stamina ran out for Murray and Ninge before the final 26 possessions of the game.

However, Isaiah Thomas led Bobby Knight's second national champion in five years back from that point on. Iowa only got one bad call against them as the road team, and that was when Ray Tolbert did score, but a foul was incorrectly called on Iowa defender Joe Wieskamp, giving Tolbert the and-one which he made to cut it to 49-44 with 19 possessions (11:22 left to play).

However, soon thereafter we made a strategy change for Indiana, realizing that while we had set up the game with Landon Turner and center and Ray Tolbert at power forward, it actually made more sense to reverse them and have Tolbert's 1-6 rebound and 21-23 blocked shots at center to lessen the chances of Garza grabbing an offensive rebound and giving a chance at blocking his follow-up shots.

This paid dividends as Tolbert blocked five shots, three times on Garza, and evened up the rebounding a bit down the stretch though Iowa still won the glass 42-33 overall (see stats on bottom of score sheet).

While the backcourt of Isaiah Thomas (13 points) and Randy Wittman (19 points) led the comeback, but it was tougher because Iowa's two guards avoided five plays that would have been a foul on almost anyone else but because they have no fouls on their defensive card (37-36 foul range means no foul range at all) which avoided a foul twice on rolls of 36 when Thomas or Wittman had the ball and three more times when a 66 was rolled which as the home team Indiana could have changed from a 66 to 36 to get a "home job" foul call against most players.

The last few minutes were extremely tight.

With 3:22 to play, Garza avoided a turnover on a "41" as he has no turnovers on the 41-46 turnover range, and then scored to cut it to 63-64. With 1:30 left, Thomas went in for what would have been a score on a "5" on the 1-20 dice, but on the "32" defensive dice let's anyone on the court with a 21-30 block the shot - which Garza did to keep the score 65-66 Indiana.

Iowa's CJ Frederick drew a foul to extend the game but missed both free throws, and then Joe Wieskamp was fouled and made only one of two to tie the game to make it 68-68 with 53 seconds left. Thomas then drove and scored to make it 68-70 Indiana, Garza (17 points, 14 rebounds) hit the three pointer to make it 71-70 Iowa, and Wittman finished the game with a buzzer beater and the 71-72 win.


B10 VABG Reminder Set-up for Game and Home Advantages

For Christmas Day Basketball we decided to use the home advantage advanced rules for some Big Ten match-ups. Under the Value Add Basketball Game rules games can be played on a neutral site, which we have done with most of the games we have tracked.

This blog is a good reminder on how to set up the game - see steps through the end of the blog.

However, we chose to play the following three Big Ten games with a home advantage:

Iowa 2021 at Indiana 1981
Michigan 1989 at Iowa 2021
Illinois 1989 at Michigan 1965

Under these rules, the home team can reverse any role of 36 or 66. If the visiting team has the ball and a "36" comes up, that would usually (but not always) result in the home team committing a foul. The home team can reverse that to a "66" so the referee missed the foul call. The reverse is also true, if the home team has the ball and a 66 is rolled, the home offense can reverse the result to a "36" which means the referee gave them a foul call that should not have been called. 

Over the course of a game, that will result in a few bad calls in favor of the home team, that will result in about a 3-point advantage for the home team.

The reason we picked those teams is that it gets them all to three games played - the teams ranked #1 to #37 have all played between three and nine games, so we are trying to work through and get every great team up to at least three games played.

We can then have Loyola Marymount travel to #49 Missouri, which will mean the top 49 teams have all played at least three games. 

Here are the teams ranked from #38 to #47 all-time. The number to the left is their ranking among all-time great teams in our game. After a key player from their team is listed, we then list their average points score and allowed, and then an overall ranked and their conference. So Michigan 1965 featuring Cazzie Russell is 1-1, has won their average game by a 81.0 to 71.5 score, and has a rating of 2.5.
 
38Michigan1965Cazzie Russell  11     81  71.5   2.5B10
39Iowa2021  Luka Garza   10      88    69   2.4      B10
40Loyola Marymount (WCC)1990  Bo Kimble   11  119.5    110   2.3     Mid-Maj
41Syracuse2003  Carmelo Anthony   21      76     74   2.3      ACC
42Illinois1989  Nick Anderson   11      78     77    2      B10
43Oklahoma1985  Wayman Tisdale   31    75.3   73.8  1.9      B-12
44Cincinnati2002  Jason Maxiell   22    72.8    71.5  1.9      Amer
45Missouri1982  Steve Stipanovich   20    69.5    65.5  1.5      SEC
46Michigan1989  Glen Rice   02    70.5    78.5  1.3      B10
47Indiana1981   Isaiah Thomas   11      73      73  1.3      B10

Other Set up reminders

When you set up the game, there are adjustment reminders if you plan not to use all players, since each player starts with at least 2 points, 1 foul and 1 rebound that must be given to other players. In this case 1981 Indiana's players have enough stamina that you only need seven players. Since 2 players will not be in the game, I added two points each to Isaiah Thomas (top right), Wittman and Tolbert to start each with 4 points instead of 2 points to give Indiana 20 points at the start of the 20-20 play in the game.

For the 3 rebounds we need to replace, I always work up from the starting center (Turner) so add one rebound to him and then one to Tolbert and Kitchel, the two forwards (we still call the "3" and the "4" the small forward and power forward for easy reference, even though they are often really just bigger guards with modern teams. 

Finally and most important, we need to add three fouls, and try to do it in hopes that the extra foul doesn't make anyone foul out. Obviously I added a foul to two subs, but then picked Wittman for the other extra foul since with only a "36" for fouls on his card - particularly in a home game where a 36 can be turned to a 66 - he is less likely to pick up additional fouls.

The other key in this game is the low dunk ranges and good defensive adjustments to opponents dunk ranges. If you go to the chart in teh game, Iowa is a 51-50, which means they have no automatic dunks, while Indiana calculates as a 51-48, and since that is two below no dunks it actually changes to any 51-52 being a STOP - meaning the shot is missed and defensive player gets the rebound automatically.


The instructions show coins being used to keep track of who is in the game, but another method is just to write the numbers on the team sheet. In this case, Isaiah Thomas and two other starters will play the whole game, so I write 1, 2 and 4 on their cards to show they will be in the whole game, but then 3 and 5 by the two players who will be replaced by a player on the top line. Once I cross those out and write 3 and 5 on the top line I will circle those because they will be in for the rest of the game once inserted.

Also wrote out who gets the ball on the 6, 7 or 8 roll as shown (we suggest using dimes on player getting an extra die roll if you use coins to track who is in the game).


Notice Iowa is much more confusing in their substitutions, with all 10 players being used a lot and noone on the team playing the whole game. Therefore noone is circled, but I also had to play around trying to figure out the possessions each should be in the game and writing in what possessions they would play at what position. One reason I try to play each team a few times is to catch where I have not listed suggestion rotations for a team, so I will likely add the numbers written on these cards back on the master set of cards on the google docs. Also notice that Keegan Murray, who went onto be one of the top players in the country the next year, actually played less than half of games in this season while Luka Garza was National Player of the Year.


Some who play the game have had trouble getting the scoresheet to print out correctly, with the top line being cut off or all 21 images printing from the instructions when they want to just print the scoresheet. I will show these in reverse order, but the image below shows what you hope to see on your printer that will give you a clean print of the whole scoresheet.

The screen below shows how you get to this screen - click on the scoresheet, then right click on it and save the image to your computer. From that point on, you can always pull that image up from your computer to print this image.


Wednesday, December 21, 2022

Annual End of Year Consideration - Please Click

 Sorry our content is often low around the end of year. This is the time I am focused on raising money for my non-profit, Take Back Action Fund.

You know as a reader, we never charge for either of our games - Statis-Pro Baseball and the Value Add Basketball Game - or the player cards we make for either one. We put out annual Statis-Pro Baseball cards and have produced the all-time 60 great teams as well as the all-time international teams. The basketball game includes 135 all-time great college basketball teams from the 1940s through the 2021 Baylor national champs. We also produced the 2020 teams to play off the strike cancelled season, and now have a programmer working on a great tool that we hope can create all teams from the beginning of Ken Pomeroy's pages. Another person developed PDFs to make the Statis-Pro game easier to play.

We hope you enjoy either or both games or other content on these pages as we approach half a million visits.

While this page will always be my unpaid labor of love, if you do make end-of-year contributions to non-profits, we certainly appreciate you clicking here to contribute to fund my day job at Take Back Action Fund. Thank you for your once a year consideration.

Saturday, December 17, 2022

UConn Stopped by Pressure Again with 22 TOs vs Hogs "40 Minutes"

We noted an interesting triangle of games when we first invited the Value Add Basketball Game and were playing just teams from the www.kenpom.com era this century. The UConn 2004 with their dominant size lost by double digits 61-74 vs. the speedy Louisville 2013 team (now 18th in our all-time rankings). However, that UConn team then dominated the Villanova 2018 team (now 5th in our all-time rankings) 73-56. However, Nova then beat Louisville 77-73 to complete the triangle with all three teams going 1-1 against each other. 

Saturday the UConn 1999 team from five years earlier likewise could not handle pressure. Another of the all-time great pressure teams, the 1994 Arkansas "40 minutes of hell" defense, forced 22 UConn turnovers in a lopsided 82-61 win. 

Both superstars had great games, as Arkansas' Corliss Williamson went off for 31 points and 3 blocked shots, and UConn's Richard Hamilton scored 20. Arkansas surges to 15th on our all-time rankings and game log spreadsheet to solidify our Top 25 now that the top 37 teams have all had a chance by playing at least three games against other great teams. The highest ranked team is Cazzie Russell's 1965 Michigan team with a 1-1 mark and ranking 38th out of our 135 all-time great teams in the game.

Another fun note was a 7 year old wanted to roll the dice while I played, with me just telling him the results of the roll. He picked up on things. At one point he said, "are the really low numbers on the 20-sided dice like 1 and 2 when they make 3-point shots?" to which I answered, "unless the defender steals the ball or blocks the shot." Then he asked on another possession "why didn't Arkansas get to try to get a rebound when they missed?" and I showed him that there is only a chance for an offensive rebound on the gray shaded possessions but on the plain white possessions the defense always gets them.

While the UConn 1999 team takes a hit with the loss, the UConn 2004 team rounds out the top 10 - 1, UCLA 1972; 2, Duke 2001; 3, Kansas 2008; 4, Kentucky 1996; 5, Villanova 2018; 6, Kansas 1997; 7, UNC 2005; 8, Indiana 1978; 9, Ohio State 1960; 10, UConn 2004.