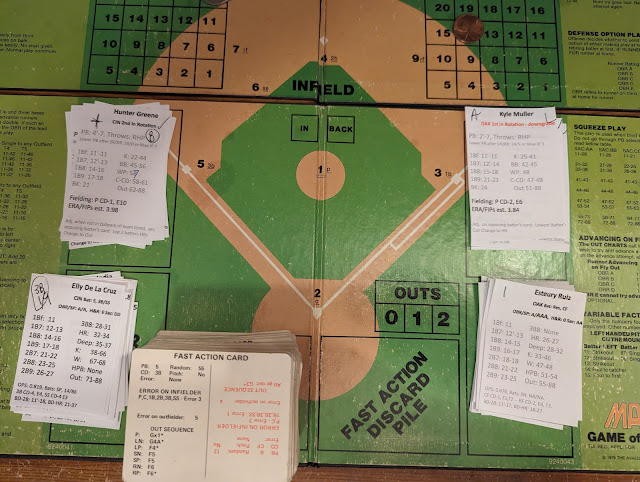
As the rematch of the 1972 and 1990 World Series lines up in our home-and-home Oakland vs. Cincinnati game, here is a reminder on the home run chart. On a deep drive in Oakland Coliseum in the first game the ball will only leave the park on 11-15, and be a sac fly on 16-88. for the second game in Cincinnati, the ball will fly out on anything from 11-63.
| LU | Pos | Oakland Starters | Card OPS | Game |
|---|---|---|---|---|
| 1 | CF | Esteury Ruiz | 0.676 | |
| 2 | 2b | Zack Gelof | 0.875 | |
| 3 | RF | Seth Brown | 0.753 | |
| 4 | RF | Tony Kemp | 0.692 | |
| 5 | LF | Brent Rooker | 0.701 | |
| 6 | DH | Shea Langeliers | 0.687 | |
| 7 | C | Carlos Perez | 0.601 | |
| 8 | SS | Nick Allen | 0.604 | |
| 9 | 3b | Kevin Smith | 0.615 | |
| A | P1 | Kyle Muller | 3.84 era | |
| D | P4 | Paul Blackburn | 4.27 | |
| B | P2 | Ken Waldichuk | 3.87 | |
| C | P3 | Adrian Martinez | 4.03 | |
| Cl | Hogan Harris | 3.8 |
This is one reason the Oakland A's pitchers ERAs are pretty good, but their hitting is very weak with most of their line-up sporting an OPS below .0.700. However, this is factored into the cards so they should hit better than that in Cincinnati's hitter friendly ballpark.
.png)
.png)

Reds drop the opener 3-2 at Oakland, leaving the tying run in third base in the 9th.

2nd game. India's 3-run homer in the 6th helped Cincy pull off a 7-2 win which counts as a sweep, meaning they take the series 4 games to 2 despite losing the first game. India's homer occurred in his lowest out number because Oakland's pitchers allow that to offset their advantage of pitching in a pitchers park.


The Reds are now 4 games out of our last playoff spot with only two series left, against the bearable Rockies but then the Dodgers.
No comments:
Post a Comment