Saturday, April 7, 2018

Instructions for Playing Statis-Pro Baseball from MLB, to minors/youth/college to Japan (Ohtani vs. Suzuki)

We consolidated various sets of instructions on Statis-Pro Baseball game into the following.

We consolidated various sets of instructions on Statis-Pro Baseball game into the following.

You can also read these instructions in this updated grid, or use the 3rd sheet on this google sheet which also includes all of the great team pitchers and hitters.

Basic Understanding of the Game 1

What you need to play 2

1. Dice or Fast Action Cards. 2

2. Player Cards 2

How to Play the Game 3

Setting Up 4

Order of Play 4

2-12 number: 4

11-88 number - 11 possible results (hits, balks, Ks, Walks, HBP, WP, PB, Out) 4

Left vs. Right Adjustment 12/88, 88/11 or other. 5

If Result is OUT: 5

Chance of Error on Hit or Out 6

Once you determine a player who might make an error - E-0 to E-10 6

SR and RR - How Long Can a Pitcher Pitch Before Getting Tired? 10

Taking Extra Bases on Hits, Hit and Runs, or Bunts 11

Optional Advanced Rules 13

Clutch Batting (BD): 14

Clutch Fielding (CD or for catcher CD-C): 14

Z-Play - unusual plays, injuries and tough fielding plays: 14


Statis-Pro Baseball was invented by Jim Barnes in 1970, and in an interview he invited others to adopt and update the game as “open source.” Our free version enables you to either play current teams with projected players, or to choose from 60 all-time great baseball teams. There is a complete game and many seasons of great advanced Statis-Pro cards on the Statis Pro Advanced Facebook page, if you want to try the game here first and consider ordering from them if you determine you like it.

Basic Understanding of the Game


The unique aspect of the game is that each plate appearance starts by determining if the pitcher is in control of the at-bat and his card will be used, or if he “makes a mistake” to put the action on the batter’s card and give him a chance for an extra base hit. An initial roll of two-tradition 6-sided dice or a use of “fast action cards” yield a number of 2-12. The best pitchers keep it on their card on 2-9, while the worst pitchers only control the action on a 2-4. Once you know whether the batter or pitcher card will be used for that at bat, a subsequent roll of two 8-sided dice for a result of 11-88 or a similar number from the fast action card gives the result of the plate appearance.

What you need to play

  1. Dice or Fast Action Cards. 

You need one of the three things in these photos. If you choose to use dice, you need two traditional 6-sided dice, two 8-sided dice of different colors, and one 20-sided die. If you prefer to use the free fast action cards we provide, they look like the all-white card below. Others sell much nicer fast action cards, so google “statis-pro baseball fast action cards” and you can find a set for $10 - you can see the blue and green corner of one of those cards and they really do add to the game..



  1. Player Cards 

Next, choose the teams you want to play. If you want to play two of the 60 all-time great teams, print the pitchers (see 1995 Braves below) from this pdf (one team to a page) and then follow these directions to print out the batters (see 1927 Yankees below) from a google sheet. If you prefer to play modern players, then choose the pages of the teams you want from all 2022 Projected Batters (49 pages, 9 cards to a page) and All 2022 Projected Pitchers (62 pages, 9 cards to a page) - the cards will have ranges like the Scherzer vs. Betts cards below. So you will be using EITHER team sheets of players or individual cards of players.


How to Play the Game

Setting Up


Choose a player on each team to pitch and play the other 8 positions - C, 1B, 2B, 3B, SS, LF, CF and RF. Next choose if you will use an extra batter as a designated hitter (DH) or have pitchers hit in the game. Once you choose the 9 who will start the game, write them down in the order they will hit from 1st through 9th.


If you are using cards you can shuffle them, but if you printed out our free ones, you may just want to put them all in a big bowl to pull out the cards one at a time. Of course, if you are using the five dice then no shuffling is needed.


If you are using player cards, you can stack the line-up in order. If using team sheets, you may want to use a couple of business cards to put below each batter as they hit.


Order of Play


2-12 number:

Get a result of 2-12 from flipping a card or rolling the dice. If that number falls within the pitcher’s PB rating (pitcher or batter) then the action will occur on the pitcher’s card, and if outside that range it will occur on the batter’s card. The possible PB ranges on pitchers’ cards, from best to worst, are 2-9, 2-8, 2-7, 4-7, 2-6, 2-5 or 2-4.


If you choose to use optional advanced rules, look at the bottom of these rules for CD, BD or Z-plays, which can occur in place of the 2-12 number.


11-88 number - 11 possible results (hits, balks, Ks, Walks, HBP, WP, PB, Out)

On the 2nd card, read the second number (Random Number 11-88) to see what happens on that card, or look at the 8-sided dice for the 11-88 number.. (If noone is one base, change any BK, WP or CD on line 2 to an OUT).


Here are the 10 possible results:


1B = Single 

2B = Double (only on batters' cards)

3B = Triple (only on batters' cards)

HR = Home Run (only on batters' cards)

BK = Balk if anyone on base (only on pitchers' cards, if no one on base treat as OUT)

K = Strikeout 

W = Walk 

CD-C = Catcher Clutch Defense - if not using advanced rules treat as out

HPB = Hit by Pitched Ball (only on pitchers' cards)

WP/PB = Wild Pitch or Passed Ball  (only on pitchers' cards, if no one on base treat as OUT)

Out = see below.


If using player cards, the card will also indicate the fielder who gets the ball on a single (1Bf, 1B7, 1B8 or 1B9) or double (2B7, 2B8, 2B9). If using a sheet, the reading is simply 1B or 2B so use the second digit of the number to determine the field. A 1 or 2 (11, 12, 21, 22 etc.) indicates the batter pulled the ball, so a RN or RP hits it to LF, a SN, SP or P to CF and a LN or LP to right. If the last digit is 3 or 4, the hit goes to LF, 5 or 6 goes to CF and 7 or 8 goes to RF.


On old fast action cards, you would check after a WP or BK for a “yes” or “no” result, but skip that step even if using those old cards. If anyone is on base, the WP or BK occurs if it comes up on the card.

Left vs. Right Adjustment 12/88, 88/11 or other. 

The Cht numbers at the bottom right of the batter card indicates numbers on which results are adjusted based on if the opposing pitcher is right-handed or left-handed. The standard 12/88 for a left-handed batter indicates that an 11 or 12 is changed from a hit to a strikeout against a left handed pitcher, and an 88 is changed from an out to a single with runners advancing two bases against a right-handed batter. The standard right-handed batter has an 88/11 meaning an 88 against a left-handed pitcher is a single, runners advance two bases while an 11 is changed to a strikeout against a right-handed pitcher. Typically a switch-hitter is –/– meaning no adjustment.


For some batters there are more numbers impacted, for example a 14/85 would be the most extreme possible adjustment, and mean the batter struck out on 11-14 against lefties, and had singles with runners advancing 2 bases on 85-88. Just remember the number to the left of the dash is the adjustment against lefties, and the number to the right of the dash is the adjustment against righties. Further, the number either goes all the way down to 11, or all the way up to 85 from what is listed.

If Result is OUT:

If the result is an OUT, the fast action cards we provide will tell you what type of out is made.


If using the nice Fast Action Cards you produce then the following will tell you what happens to runners on base.


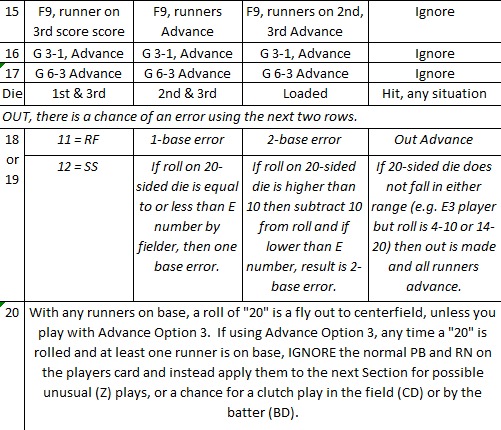
G6A (grounder to short) or any other A at the end of a grounder tells you the batter is out, but all runners advance.


Gx6 or any other reading with an x in the middle indicates runners hold and if there is a force out then the defense can throw out a forced runner. However, if runners are on 1st and 3rd then the defense must choose whether to take the out at second base and let the runner on third score or hold the runner at third and throw out the batter to leave runners on 2nd and 3rd.


G6 or any other reading with no x or A indicates a double play grounder if a runner is on 1st. However, if there is a runner on 3rd and no outs, the defense needs to either hold him and just throw the batter out at 1st, or let him score and turn the double play. If bases are loaded with no outs, the defense can choose to either throw the runner out at home, or take the double play from 2nd to 1st and let him score.


Chance of Error on Hit or Out

An error can occur under any of the three systems you can use for random numbers.


If using dice, any time a 18 or 19 on the 20-sided die is rolled there is a chance for an error. On a hit, the outfielder who fields the ball could make an error to allow an extra base on the hit, while on an Out the player could allow a 1- or 2-base error instead of an out.


On the nice Fast Action Cards you can buy from someone, a * will appear by the out result to let you know to check for errors on the next card. When using those cards, check for an error only on hits on the batter’s card - there is no chance of an error on a hit off the pitcher’s card.


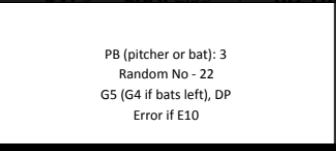
If using the free fast action cards we provide, the Error Reading on the 4th card is only used if; there is a hit on the BATTER card on line 2 OR, there is a possible error (e?) on line 3 with an out. If the fielder's E number is in the range on this 4th line then everyone is safe in an out or gets an extra base on a hit. Flip for another 11-88 and if the number is 61-88 give batter and runners one additional base for a throwing error.


Once you determine a player who might make an error - E-0 to E-10

If there is a chance of an error on a player, then the next fast action card will determine if the error is in the player's range. A player can have anywhere from an E-0 (the best, never makes an error) to the worst E-10. If using the fast action cards, the next card will tell you if the error is in that range (e.g. Error 3-10 would be an error for an E-3 but not for an E-2).


If using dice, the 20-sided die determines the same thing with a roll of 3 meaning the same as a 3-10 range is an error. If the roll is 10 or higher, then subtract 10 but if it is an error then it is in the range. So a 13 die roll would be a 2-base error for an E-3, but no error at all for an E-2.


Obviously you cannot have a double play with noone on base, pardon the type under “1” with bases empty, just a grounder from shortstop to first base.


SR and RR - How Long Can a Pitcher Pitch Before Getting Tired?


The SR number is used for a starting pitcher, and RR used for a relief pitcher to see when they tire in a game.


For example, Greg Maddux on the sheet above would start at 15 or his SR.


This number is lowered by 1 every time the pitcher:


  1. Allows a runner to reach 1st base (unless on an error that is not his fault)

  2. Allows an earned run

  3. An inning ends while he is pitching (whether he started that inning, or cam in after it started)


Once a pitcher’s SR or RR is reduced to 0, his PB drops by 1, and then every additional education from one of those three occurs it is reduced by one more. If a pitcher started with the best rating of PB 2-9, then when he hit zero he would drop to PB 2-8, and then to 2-7, 4-7, 2-6, 2-5, 2-4, 2-3, 2-2 and if reduced further then the rest of the batters faced would skip the 2-12 number and automatically go to the 11-88 on the batter’s card.

Taking Extra Bases on Hits, Hit and Runs, or Bunts


Normally after getting the result you move onto the next batter. However, you can opt for any of the following strategies to advance base runners rather than going immediately to the next batter and the next 2-12 number.


Here are charts with various options. Note I have made some changes in writing after reviewing stats on frequencies of various scenarios. 


On bunts, we do have some all-time great players whose Sac (bunt) rating is AA+. The first time an AA+ player bunts in a game, use the AA column on the sacrifice chart BUT on an 11-28 he is safe at first base on a single. 


When a runner tries to take an extra base on a hit, the chart is used for the numbers on which he makes it to the next base. However, in some cases he cannot make it the extra base, but he is not thrown out either, he just sees a strong throw coming and stops at the base. He is only thrown if the 11-88 number for the throw is a 71-88 from a T-5 throwing arm for the outfielder, or a 75-88 for T-4, 81-88 for a T-3 and finally 85-88 for a T-2. Players advancing or being thrown out in modern baseball is even more rare, with layers taking the next base only 30 percent of the time and only being thrown out 1 percent of the time.


Optional Advanced Rules


You can choose to ignore a BD, CD or Z-play result to keep the game simple. If so, just ignore and play the 2-12 range to use the batter or pitcher card instead.


If you choose to play the advance rules, these can come up instead of the 2-12 number in the following ways.


If using dice, a roll of 20 on the 20-sided dice can overrule the 2-12 rating only if runners are on base.


If using fast action cards, in some cases a BD, CD or Z will come up instead of a 2-12 on some cards. With Fast Action Cards, Z-plays do happen even if noone is on base, but BD or CD is skipped if noone is on base.


Clutch Batting (BD):

If at least one runner is on base and the results is BD, or clutch batting, then the 11-88 number results in one of the following:


If the number would result in a 1B on the batters cards, then make the result is a 2B (double) and all runners on base score.


If the number would result in a 2B, 3B, HR or Deep on the batters card, then change to a home run.


If the number would have resulted in anything else on the batters card, then change to a foul ball, and the batter is still at the plate.


Clutch Fielding (CD or for catcher CD-C):

If the result is a CD-C then use the catcher's clutch defense rating from 1 to 5 but simply score as an Out if noone is on base. If a CD results and anyone is on base, then check to see which fielder has a chance to make a play. The fast action card will indicate which player, but if using dice then refer to the 2-12 number to determine the player.  If are using dice to determine which player has a chance for a clutch defensive player, or might commit and error - then use the following numbers:


2 or 3 = 1B, 4 = P, 5 = CF, 6 = 3B, 7 or 12 = SS, 8 = 2B, 9 - LF, 10 = C, 11 = RF.


Once you know the position, use that players CD rating of 1 to 5 then the 11-88 number on the chart below:


Z-Play - unusual plays, injuries and tough fielding plays

The following charts are used if an unusual “Z-Play” occurs. Draw a new 11-88 number.


2nd to home on 1b T2                            T3                           T4                           T5                        
OBR A11'-87 / out 8811'-77 / out 85-8811'-67 / out 83-8811'-57 / out 81-88
OBR B11'-77 / out 87-8811'-67 / out 85-8811'-57 / out 83-8811'-47 / out 81-88
OBR C11'-67 / out 87-8811'-57 / out 85-8811'-47 / out 83-8811'-37 / out 81-88
OBR D11'-57 / out 87-8811'-47 / out 85-8811'-37 / out 83-8811'-27 / out 81-88
OBR E11'-47 / out 87-8811'-37 / out 85-8811'-27 / out 83-8811'-17 / out 81-88
     
1st to home on 2bT2T3T4T5
OBR A11'-73 / out 87-8811'-63 / out 85-8811'-53 / out 83-8811'-43 / out 81-88
OBR B11'-63 / out 87-8811'-53 / out 85-8811'-43 / out 83-8811'-33 / out 81-88
OBR C11'-53 / out 87-8811'-43 / out 85-8811'-33 / out 83-8811'-23 / out 81-88
OBR D11'-43 / out 87-8811'-33 / out 85-8811'-23 / out 83-8811'-13 / out 81-88
OBR E11'-33 / out 87-8811'-23 / out 85-8811'-13 / out 83-88Cannot attempt
     
1st to 3B on 1B9T2T3T4T5
OBR A11'-73 / out 87-8811'-63 / out 85-8811'-53 / out 83-8811'-43 / out 81-88
OBR B11'-63 / out 87-8811'-53 / out 85-8811'-43 / out 83-8811'-33 / out 81-88
OBR C11'-53 / out 87-8811'-43 / out 85-8811'-33 / out 83-8811'-23 / out 81-88
OBR D11'-43 / out 87-8811'-33 / out 85-8811'-23 / out 83-8811'-13 / out 81-88
OBR E11'-33 / out 87-8811'-23 / out 85-8811'-13 / out 83-88Cannot attempt
     
1st to 3B on 1B8T2T3T4T5
OBR A11'-63 / out 87-8811'-53 / out 85-8811'-43 / out 83-8811'-33 / out 81-88
OBR B11'-53 / out 87-8811'-43 / out 85-8811'-33 / out 83-8811'-23 / out 81-88
OBR C11'-43 / out 87-8811'-33 / out 85-8811'-23 / out 83-8811'-13 / out 81-88
OBR D11'-33 / out 87-8811'-23 / out 85-8811'-13 / out 83-88Cannot attempt
OBR E11'-23 / out 87-8811'-13 / out 85-88Cannot attemptCannot attempt
     
1st to 3B on 1B7T2T3T4T5
OBR A11'-53 / out 87-8811'-43 / out 85-8811'-33 / out 83-8811'-23 / out 81-88
OBR B11'-43 / out 87-8811'-33 / out 85-8811'-23 / out 83-8811'-13 / out 81-88
OBR C11'-33 / out 87-8811'-23 / out 85-8811'-13 / out 83-88Cannot attempt
OBR D11'-23 / out 87-8811'-13 / out 85-88Cannot attemptCannot attempt
OBR E11'-13 / out 87-88Cannot attemptCannot attemptCannot attempt


Decide before the game if you want these optional adjustments to the ranges above.


Optional AdjustmentsUse 1st that appliesif 0 or 1 outsif 2 outs
Regular Hitany odd number RNSameadd 20
Texas Leaguercan divide RN by 12add 40add 60
Bloopcan divide RN by 4add 20add 40
Line Drivecan divide RN by 2subtract 20Same

The numbers above are based on these numbers.
   
Random Number 11-88                1st to 3rd on 1B2nd to home on single1st to home on double
Advances Extra Base11-3311-5711-43
Only advances same as hitter34-8758-8544-86
Out trying to Advance8886-8887-88
    
Based on actual occurances through 7/4  1st to 3rd on 1B2nd to home on single1st to home on double
Advances Extra Base252428871062
Only advances same as hitter569117071420
Out trying to Advance10919162

Below are the Clutch Defensive Charts so you have them in one place.

C-CD (Catcher)CD1      CD2      CD3      CD4    CD5
Foul Out11'-1812'-1811'-3811'-4811'-58
Passed Ball21-5831-5841-5851-5861-64
Infield single61-8861-7861-6861-6465-66
Lead runner out 81-8871-8865-8867-88
      
1st Base & 3rd BaseCD1CD2CD3CD4CD5
Line Out, Lead Runner Doubled off11'-1811'-2811'-3811'-4811'-58
Grounder, lead runner thrown out even if no force21-2831-4841-5851-6861-78
Line Drive single, advance 2 bases31-5851-6861-7871-8481-88
Double down line, runners score61-8871-8881-8885-88 
      
Shortstop, 2nd Base or PitcherCD1CD2CD3CD4CD5
Line Out, Lead Runner Doubled off11'-1828-Nov11'-3811'-4811'-58
Grounder, lead runner thrown out even if no force21-2831-4841-5851-6851-78
Hard Grounder through for Single, runners advance 2 bases31-8851-8861-6871-8881-88
      
OutfielderCD1CD2CD3CD4CD5
Line Out, Lead Runner Doubled offNoneNone11'-1411'-1811'-24
Nice catch of line drive, runners hold11'-1811'-2815-3821-4825-48
Nice catch of deep drive, runner on 2nd and/or 3rd advance21-2831-4841-5851-6851-78
Line drive single, advance 1 base31-5851-6861-7871-8481-88
Line drive double, runners score61-7871-8281-8685-88 
Line drive triple81-8883-8887-88 


Here is the updated Steal Chart.

 
Results (not odd RN never out stealing, worst case holds)                       Steal 2b     Steal 3b
Steal unless SP: E11'-1411'-14
Steal if AAA, AA, A, B or C15-2315-17
Steal if AAA, AA, A or B24-3218-28
Steal if AAA, AA or A33-4631-38
Runner Out Stealing (odd number holds)47-5241-52
Runner Out if Catcher TA or TB (steal if TC, if out on odd RN holds)53-5653-55
Runner Out if Catcher TA (steal if TB or TC, if out on odd RN holds)57-6356-61
Holds, cannot get break64-6862-67
TA picks off catcher, otherwise hold71-7168-68
TA or TB picks off catcher, otherwise hold72-7271-71
Steal if AAA or AA73-7872-76
Steal if AAA81-8877-82
Runner Holds 83-88


Here are the Z-Plays so you have all in one place.


Friday, April 6, 2018

Baseball Breakdown of Double Play Grounders and Would-be Sac Flies Per Out

Because I wanted to revisit Statis-Pro baseball and distribute outs and errors with a 20-sided die rather than their playing cards, I broke down the 185,000 plus times a batter stepped up to the plate last year and provided the numbers under the "All PA" column below.

The error number is not a true percentage, because in fact multiple outs can be recorded on a given playmaking fielding averages appear even higher than they are per play, but let's skip that for now.


All PAOpportunityIn play outper 20-sided die1B or 2B
TPA185498185498863092050050
1b268802688026880
2B840084008400
3B810810
HR61206120
GB 1 out4029831818318177.4
GDP38100.3112290122902.8
Infield error2070207020700.5
SF11700.0913000130003.013000
Fly Ball out3746225632263826.1
OF or C error7507507500.2
SO3822838228
BB1584015840
HBP177017701770
SH930choice930
IBB960choice960

The most important thing I needed to break out was the chance of a double play grounder and of a sacrifice fly in order to give the proper chances of each on my 20-sided die - each representing a 5% chance of something happening through a subsequent role of the die if the first one came up "20" could give a 0.25% chance on two rolls.

At first tally, there were on 3,810 double-play grounders. However, there is only a man on first and less than two outs 31% of the time so we can reverse engineer to estimate there were 12,290 balls hit like a double-play grounder - but 69% of the time they just turned into groundouts because there was no force for a double play.

There were only 1,170 sacrifice flies, but there is a man on third with less than two outs only 9 percent of the time, so likewise we can reverse engineer that an estimated 13,000 balls were hit deep enough to be sacrifice flies but 91% of the time no one was on 3rd base to run home and give credit. Most do not realize that a batter does not get a sacrifice fly credit if a runner goes from 2nd to 3rd base on his fly ball.

Once you take away all the hits, strikeouts, walks and decisions to either bunt or intentionally walk a batter, we are left with 86,309 times that a batter hit a ball that resulted in an out or someone reaching on an error. When you break that down to a 20-sided die, we find 3 of the sides should equal a double play grounder and another 3 equal a sac fly. You also have 7 other clean groundouts, 6 other clean foul balls, and then some fractions that we break down into a second roll of the die if a 20 comes up the first time.


DieOut on card (DP if force, if not runners hold and out at 1st)
1DP
2DP unless batter OBR A
3DP unless batter OBR A-B
4DP unless batter OBR A-C
5DP unless batter OBR A-D
6Ground Out Runner A Advance
7Ground Out Runner A-B Advance
8Ground Out Runner A-C Advance
9Ground Out Runner A-D Advance
10Ground Out Runner Advance
11Fly Out
12Fly Out
13Fly Out
14Fly Out, runner OBR A on 2nd or 3rd Advance
15Fly Out, runner OBR A-B on 2nd or 3rd Advance
16Fly Out, runner OBR A-C on 2nd or 3rd Advance
17Fly Out, runner OBR A-D on 2nd or 3rd Advance
18Fly Out, runner on 2nd or 3rd Advance
19-20Roll Again Below - possible defensive play
2nd roll below
2 dice new rollBased on two 6-sided dice out hit to: 2 or 3 = 1b, 4 = P, 5 = cf, 6 = 3b, 7 or 12 = SS, 8 = 2b, 9 = pulled to outfielder, 10 = C, 11 = opposite field outfielder.
1out runners advance, BUT 2-base error if E reading 1 -10
2E1-10 1-base error, OTHERWISE OBRA or B lead runner beats attempted throw, all safe - otherwise lead runner out
3out runners advance, BUT 2-base error if E reading 2-10
4E2-10 1-base error, OTHERWISE OBRA lead runner beats attempted throw - otherwise lead runner out
5out runners advance, BUT 2-base error if E reading 3-10
6E3-10 1-base error, OTHERWISE Fielder throws out lead and DP if force, or OF diving catch - otherwise batter out all others advance
7out runners advance, BUT 2-base error if E reading 4-10
8E4-10 1-base error, OTHERWISE Fielder throws out lead and DP if force, or OF diving catch - otherwise batter out all others advance
9out runners advance, BUT 2-base error if E reading 5-10
10E5-10 1-base error, OTHERWISE CD2-4 throws out lead and DP if force, or OF diving catch - otherwise batter out all others advance
11out runners advance, BUT 2-base error if E reading 6-10
12E6-10 1-base error, OTHERWISE CD2-4 throws out lead and DP if force, or OF diving catch - otherwise batter out all others advance
13out runners advance, BUT 2-base error if E reading 7-10
14E7-10 1-base error, OTHERWISE CD3-4 throws out lead and DP if force, or OF diving catch - otherwise batter out all others advance
15out runners advance, BUT 2-base error if E reading 8-10
16E8-10 1-base error, OTHERWISE CD3-4 throws out lead and DP if force, or OF diving catch - otherwise batter out all others advance
17out runners advance, BUT 2-base error if E reading 9-10 - OPTIONAL NEXT PLAY IS Z PLAY
18E9-10 1-base error, OTHERWISE CD4 throws out lead and DP if force, or OF diving catch - otherwise batter out all others advance - OPTIONAL NEXT PLAY IS Z PLAY
19out runners advance, BUT 2-base error if E reading 10 - OPTIONAL NEXT PLAY IS Z PLAY
20E10 1-base error, OTHERWISE CD4 throws out lead and DP if force, or OF diving catch - otherwise batter out all others advance - OPTIONAL NEXT PLAY IS Z PLAY


On references to OBR runners, if lead runner is too fast to get defense throws out batter.

Wednesday, April 4, 2018

Value Add Projects for All 2019 Players - Final Four of Auburn, Duke, Villanova, UNC

This link to projected Value Add Rankings for close to 5,000 players provides you with a column A to make notes on any player that should be removed, changed to another team, or added in one of the "Roster Spot Open" spots for teams with fewer than 13 players in the system.

Tracking which team a given player is on is a monumental task (an Atlanta sports host tried to convince a caller that I really do work 60+ hour work weeks and just do this for fun), and I WELCOME notes correcting my mistakes - or even subjective notes on players that should be rated higher by played injures, or do things that do not show up in the stats like on-ball defense or setting picks. Just type anything you want into Column A by something you believe or know is off on a given line.

Here is a rundown of how we project the next season's Value Add rating of different sets of players.

Group 1: Freshmen. The rankings for these players is determined matching where 247Sports ranks a freshman and how freshman who ranked that high in past rankings performed.


Group 2: Returning Sophomores, Juniors and Seniors. Last year I studied the 61,000+ Value Add rankings from the 2001-02 to 2016-17 who stayed at the same school four years, and calculated the following average improvement for five groups based on how valuable they were their freshman season:


Freshman Value Add RangeFreshmanSophomoreJuniorSenior
Exactly 0.000.000.821.131.36
up to 1.000.591.181.571.90
up to 2.001.312.242.783.31
up to 3.002.222.843.483.94
3.01 or higher3.994.054.555.23
4 year players, same school0.981.662.092.48

The average improvement works out to the following:
  • A freshman with a rating of 1.01 or higher projects to improve by 1.00 his sophomore year, while others project to improve by 0.7.
  • A sophomore with a rating of 1.01 or higher projects to improve 0.8 his junior year, while others improve 0.4. 
  • A junior with a rating of 1.01 or higher projects to improve 06 his senior year, while others improve 0.3.
Further, in the system I check players against their projected NBA status and where they were originally ranked in high school - this has not been done to the 2019 projections yet, as it takes a while, but adjustments may be made based on the following:
  • A player ranked as one of the top 50 or so NBA prospects in their place have a minimum Value Add ranking based on exactly where they rank that will take the place of a lower projected Value Add using the system above.
  • A player who was highly rated as a recruit who has a bad year (often the result of injury or a lack of playing time) gets at least a rating equal to one point below the average number of stars he received as a recruit (e.g. a 5-star recruit who has a bad first year, still gets at least a 4.0 Value Add based on a history of such players improvement much more dramatically than others).
Group 3: JUCO Transfers. While 247 is my basis for freshmen, Brad Winton's JUCORecruiting.com list between 2011 to 2015 gave me averages of how his ranked JUCOs typically perform when they move to a four-year school. In short, as we saw with Jae Crowder and others, Junior College players make their big improvements before stepping on the court of a 4-year college, usually as a junior. They can instantly improve a team because their game is so much more developed than freshman recruits. As soon as Delon Wright and Gary Payton stepped on the court they made Utah and Oregon State, respectively, 10 points better than a replacement player.

Group 4: NBA Prospects. This pre-March Madness post gave each college player's chance for success in the NBA, with 10.0 being the highest. The following are three considerations for NBA prospects.

a. If a prospect Signs with an Agent or Makes clear they are leaving for the pros, then they are not listed with a 2019 Projection.

b. If a prospect is considering going to the NBA or even puts their name in the draft but does not sign with an agent then they are still listed with a slash after the team name indicating they could leave for the NBA.

c. The NBA rating is also used to calculate a minimum Value Add projection for the next season that is higher than the projection based on their previous season above. This might be needed because a player simply underperformed in the previous season, but it is also often the case that he played hurt or was on a bench at a program like Duke or Kentucky that had other NBA prospects in front of him, so that when a starting spot clears for them the next season they will likely be much higher. In that case, we calculate what their Value Add projection would be if they had played up to their potential. For example, Maryland's Bruno Fernando had a strong freshman year with a 4.76 Value Add so would have projected to improve a bit, but his NBA rating would indicate his Value Add should be almost twice as high as 9.00+, and we take 70% of that NBA projection to raise him to 6.02 for next season if he is still at Maryland. If you see "Proj raised due to NBA potential" in the notes field, it means the player's projection was raised due to NBA potential beyond what his previous season would actually project. Here is the list of all NBA prospects who had their Value Add Projection raised for 2019 beyond what they actually produced the previous year.


NBA Prospect Under performingHeightClassSchoolAdjusted VA
Bruno Fernando #236-foot-10SoMaryland6.202
Hamidou Diallo #36-foot-5FrKentucky/could go NBA5.635
Jericho Sims #206-foot-9SoTexas5.607
Bruce Brown #116-foot-5SoMiami FL/could go NBA5.39
Marques Bolden #206-foot-11JrDuke5.236
Jaylen Hands #46-foot-3FrUCLA/could go NBA5.194
Jarred Vanderbilt #26-foot-9FrKentucky/could go NBA5.173
John Petty #236-foot-5FrAlabama/could go NBA4.956
Markis McDuffie #326-foot-8SrWichita St.4.886
Kavell Bigby-Williams 356-foot-11SrOregon4.606
Donovan Mitchell #26-foot-8JrAvailable4.354
Bennie Boatwright #256-foot-10SrUSC4.2
Jeremy Hemsley #426-foot-3SrSan Diego St.4.158
Chase Jeter 26-foot-10JrArizona4.13
Yankuba Sima #356-foot-11SrOklahoma St.4.067
Corey Sanders #36-foot-2SrRutgers4.06
Tacko Fall #247-foot-6SrUCF4.053
Shaqquan Aaron #06-foot-7SrUSC4.046
Esa Ahmad #236-foot-8SrWest Virginia4.032
Haanif Cheatham #256-foot-5SrFlorida Gulf Coast3.99
Carlton Bragg 156-foot-10JrNew Mexico3.983
Jeremy Miller #116-foot-10SrNortheastern3.885
Jalen Poyser 246-foot-4SoSt. Bonaventure3.878
Brandon Randolph #56-foot-6SoArizona3.85
Kassoum Yakwe #146-foot-7SrSt. John's3.85
Jeremiah Tilmon #236-foot-10SoMissouri3.822
MJ Walker #236-foot-6SoFlorida St.3.808
DJ Harvey #36-foot-6SoNotre Dame3.801
Chris Smith #56-foot-9SoUCLA3.801
Keith Williams #26-foot-5SoCincinnati3.794
Daejon Davis #16-foot-3SoStanford3.78
Paul Scruggs #16-foot-3SoXavier3.78
Devontae Shuler #06-foot-2SoMississippi3.766
Kostas Antetokounmpo #136-foot-10FrDayton/could go NBA3.766
Emmanuel Akot #246-foot-7SoArizona3.766
Chaundee Brown #236-foot-5SoWake Forest3.759
Victor Bailey #106-foot-4SoOregon3.752
Marcus Carr #56-foot-1SoAvailable3.745
Makai Ashton-Langford #16-foot-3SoProvidence3.745
Alex O'Connell #156-foot-6SoDuke3.71
Jacob Larsen #146-foot-11SoGonzaga3.703
Abu Kigab #246-foot-6SoOregon3.696
Charles O'Bannon #136-foot-6SoUSC3.696
Isaiah Washington #116-foot-1SoMinnesota3.689
Jermaine Samuels #236-foot-6SoVillanova3.682
Malik Williams #56-foot-11SoLouisville3.675

Group 5: Placeholders to Fill Rosters. The one other item I added this year is a line for the available spots on each team's roster. If a team has nine players in the www.valueaddbasketball.com database, then they have four lines on which the "player name" is "Roster Spot Open." This year I do assign a value based on what the team can typically expect. A solid team like Marquette will average about 1.30 in Value Add filling their roster, while Kentucky averages 2.51 and can be much higher if they are waiting to decide which 5-star to take.

If you want the much longer explanation of each group presented last June, click here and link to the explanations of these and others.

The link indicates that if every team keep any more potential pro players from leaving, then Villanova projects as the best team at 69.56, Kentucky is second at 63.50, and a Final Four would round out with Duke at 56.38 and Auburn at 53.75. However, that would entail Villanova keeping the dominant trio from the National title game in Mikal Bridges (as likely lottery pick), National Player of the Year Jalen Brunson, and Tournament MVP Donte DiVincenzo. Kentucky has six current potential players who could go pro to cut them down to seven returning.

If all these players left for the pros, and every other team also lost all potential pro prospects, then Auburn would project as the No. 1 team at 50.17 (they only have one player who might leave), and Duke would be just behind them at 49.97 (only two players and not the keys to the team), with Villanova still holding onto third place even without that trio, but North Carolina replacing Kentucky to round out a projected Final Four.

Here is the whole list, but I caution that the offseason projections really do not work well on the teams outside the Top 100.


ROUGH ProjectionsConfIf no more NBA departuresRankPoss NBARating if everyone leaves for NBAEveryone leaves for NBA
VillanovaBE69.561349.913
KentuckySEC63.52645.696
DukeACC56.383249.972
AuburnSEC53.754150.171
North CarolinaACC48.77548.774
KansasB1248.046238.9514
NevadaMWC47.527236.9719
OregonP1246.62846.625
VirginiaACC45.659142.19
SyracuseACC45.510234.5333
Mississippi St.SEC45.4211139.9910
GonzagaWCC4512237.1418
Miami FLACC44.7513336.2122
MarylandB1044.2214138.6215
LSUSEC44.151544.157
North Carolina St.ACC42.671642.678
Ohio St.B1041.9517133.8541
Virginia TechACC41.5118139.5411
Michigan St.B1041.4419137.217
MichiganB1040.9420135.0827
UCLAP1240.221236.321
FloridaSEC39.9422135.7723
MontanaBSky39.142339.1412
MarquetteBE39.022439.0213
Kansas St.B1238.5225133.9838
Arizona St.P1238.022638.0216
Texas A&MSEC37.927230.1157
TexasB1237.0928134.3135
IowaB1036.8829231.8952
Florida St.ACC36.883036.8820
Boston CollegeACC36.431128.8765
Iowa St.B1235.9232133.8539
IndianaB1035.643335.6424
TennesseeSEC35.523435.5225
BYUWCC35.283535.2826
St. John'sBE35.0136129.1761
TCUB1234.953734.9528
Fresno St.MWC34.883834.8829
DavidsonA1034.843934.8430
NorthwesternB1034.834034.8331
HoustonAmer34.74134.732
NortheasternCAA34.484234.4834
WashingtonP1234.3343130.8254
AlabamaSEC34.1744327.3876
VanderbiltSEC34.124534.1236
ButlerBE34.114634.1137
Texas TechB1233.8847126.0197
South Dakota St.Sum33.854833.8540
Notre DameACC33.74933.742
PurdueB1033.6550127.5475
XavierBE33.615133.6143
ClemsonACC33.445233.4444
NebraskaB1033.2553223.77131
CreightonBE32.795432.7945
West VirginiaB1232.745532.7446
Loyola ChicagoMVC32.725632.7247
GeorgetownBE32.585732.5848
ProvidenceBE32.465832.4649
USCP1232.425932.4250
Wake ForestACC32.226032.2251
Penn St.B1031.3161126.5682
San Diego St.MWC31.286231.2853
IllinoisB1030.646330.6455
WisconsinB1030.216430.2156
MissouriSEC30.1865125.46105
SMUAmer29.9366222.14153
ArizonaP1229.726729.7258
Oregon St.P1229.726829.7259
BuffaloMAC29.396929.3960
StanfordP1229.067029.0662
UNC GreensboroSC29.047129.0463
LouisvilleACC2972126.1991
San DiegoWCC28.987328.9864
BaylorB1228.847428.8466
South DakotaSum28.587528.5867
Georgia TechACC28.4476123.55134
Georgia St.SB28.0477125.25111
DaytonA1028.0178128.4168
Rhode IslandA1027.987927.9869
MarshallCUSA27.938027.9370
BelmontOVC27.98127.971
ArkansasSEC27.898227.8972
WoffordSC27.718327.7173
TempleAmer27.78427.774
Oklahoma St.B1227.358527.3577
Northern KentuckyHorz27.038627.0378
New MexicoMWC27.028727.0279
Murray St.OVC26.878826.8780
MinnesotaB1026.718926.7181
ConnecticutAmer26.539026.5383
LipscombASun26.59126.584
RiderMAAC26.389226.3885
UC DavisBW26.359326.3586
Louisiana LafayetteSB26.359426.3587
RichmondA1026.39526.388
ToledoMAC26.279626.2789
CincinnatiAmer26.29726.290
Northern IowaMVC26.169826.1692
Ball St.MAC26.139926.1393
FurmanSC26.1310026.1394
LibertyBSth26.1210126.1295
Southern IllinoisMVC26.0210226.0296
North TexasCUSA25.9910325.9998
Northern ColoradoBSky25.9710425.9799
MississippiSEC25.8610525.86100
AkronMAC25.7210625.72101
South CarolinaSEC25.7110725.71102
OklahomaB1225.6910825.69103
Georgia SouthernSB25.6210925.62104
Saint Mary'sWCC25.4311025.43106
Fort WayneSum25.4211125.42107
Middle TennesseeCUSA25.3611225.36108
GeorgiaSEC25.3611325.36109
New Mexico St.WAC25.2711425.27110
MemphisAmer25.2311525.23112
CanisiusMAAC25.1111625.11113
RutgersB1025.111725.1114
Jacksonville St.OVC24.8611824.86115
Wichita St.Amer24.85119119.12193
RadfordBSth24.8412024.84116
HofstraCAA24.72121119.83180
Saint Joseph'sA1024.712224.7117
HarvardIvy24.6912324.69118
Utah St.MWC24.6212424.62119
DePaulBE24.4112524.41120
Old DominionCUSA24.3912624.39121
TulsaAmer24.3812724.38122
ColoradoP1224.212824.2124
UC IrvineBW24.1512924.15125
VermontAE2413024126
Weber St.BSky23.9713123.97127
Illinois St.MVC23.9113223.91128
TulaneAmer23.78133118.85198
CornellIvy23.7813423.78130
St. BonaventureA1023.6113523.61132
Wright St.Horz23.5613623.56133
ValparaisoMVC23.4813723.48135
Saint LouisA1023.3613823.36136
PacificWCC23.3613923.36137
Utah ValleyWAC23.3114023.31138
Southern MissCUSA23.1814123.18139
Idaho St.BSky23.0914223.09140
Eastern MichiganMAC23.08143124.32123
UTSACUSA22.9914422.99141
UCFAmer22.8614522.86142
St. Francis PANEC22.7114622.71143
Austin PeayOVC22.7114722.71144
CampbellBSth22.6914822.69145
College of CharlestonCAA22.4814922.48146
Seton HallBE22.4815022.48147
IonaMAAC22.4615122.46148
Stephen F. AustinSlnd22.41152123.83129
William & MaryCAA22.3715322.37149
Eastern WashingtonBSky22.3415422.34150
BradleyMVC22.2815522.28151
OhioMAC22.2815622.28152
MassachusettsA1022.0915722.09154
Central MichiganMAC22.0915822.09155
WinthropBSth22.0815922.08156
Indiana St.MVC22.0116022.01157
Cal St. FullertonBW21.9716121.97158
Southeast Missouri St.OVC21.6716221.67159
YaleIvy21.6516321.65160
Illinois ChicagoHorz21.4716421.47161
San FranciscoWCC21.2216521.22162
UABCUSA21.1116621.11163
ColumbiaIvy21.0816721.08164
TowsonCAA20.9816820.98165
PrincetonIvy20.9716920.97166
James MadisonCAA20.8317020.83167
Northern IllinoisMAC20.817120.8168
Missouri St.MVC20.7117220.71169
Grand CanyonWAC20.6217320.62170
Loyola MarymountWCC20.6117420.61171
UNLVMWC20.617520.6172
PepperdineWCC20.517620.5173
WyomingMWC20.3717720.37174
PennIvy20.2817820.28176
HartfordAE20.0517920.05177
Kent St.MAC20.0418020.04178
LehighPat19.9418119.94179
UT ArlingtonSB19.818219.8181
Charleston SouthernBSth19.78183120.36175
EvansvilleMVC19.6718419.67182
La SalleA1019.6118519.61183
North FloridaASun19.518619.5184
Louisiana TechCUSA19.4618719.46185
East Tennessee St.SC19.4518819.45186
UNC AshevilleBSth19.4518919.45187
Western KentuckyCUSA19.3519019.35188
Western MichiganMAC19.319119.3189
South AlabamaSB19.2219219.22190
TroySB19.1419319.14191
George MasonA1019.1319419.13192
UNC WilmingtonCAA19.0919519.09194
Colorado St.MWC19.0919619.09195
VCUA1019.0519719.05196
NJITASun18.9519818.95197
SeattleWAC18.8219918.82199
DuquesneA1018.5920018.59200
Louisiana MonroeSB18.5220118.52201
Texas SouthernSWAC18.4820218.48202
Coastal CarolinaSB18.3620318.36203
Southeastern LouisianaSlnd18.220418.2204
MilwaukeeHorz18.1220518.12205
ColgatePat17.9820617.98206
LamarSlnd17.9120717.91207
UtahP1217.8920817.89208
Montana St.BSky17.8520917.85209
Washington St.P1217.84210113.71263
Miami OHMAC17.7621117.76210
MonmouthMAAC17.6121217.61211
WagnerNEC17.4821317.48212
IdahoBSky17.2621417.26213
DrexelCAA17.1921517.19214
FIUCUSA17.1721617.17215
Fairleigh DickinsonNEC17.121717.1216
North DakotaBSky17.0921817.09217
Bowling GreenMAC17.0621917.06218
CaliforniaP1217.0122017.01219
Portland St.BSky16.9122116.91220
ElonCAA16.922216.9221
Nebraska OmahaSum16.8822316.88222
Saint Peter'sMAAC16.8722416.87223
UC Santa BarbaraBW16.6622516.66224
Boston UniversityPat16.4522616.45225
DelawareCAA16.4522716.45226
HawaiiBW16.4322816.43227
Eastern KentuckyOVC16.3922916.39228
Robert MorrisNEC16.2923016.29229
NiagaraMAAC16.2723116.27230
Boise St.MWC16.2623216.26231
LIU BrooklynNEC16.2423316.24232
Texas St.SB16.1123416.11233
DenverSum16.0923516.09234
Tennessee St.OVC16.0623616.06235
Nicholls St.Slnd15.9623715.96236
Appalachian St.SB15.9523815.95237
Sam Houston St.Slnd15.8423915.84238
AlbanyAE15.6124015.61239
Air ForceMWC15.5524115.55240
UMBCAE15.4824215.48241
FairfieldMAAC15.3924315.39242
Stony BrookAE15.2424415.24243
Oral RobertsSum15.2424515.24244
HamptonMEAC15.2324615.23245
OaklandHorz15.0924715.09246
High PointBSth15.0824815.08247
DrakeMVC14.9624914.96248
Cal St. BakersfieldWAC14.9125014.91249
Long Beach St.BW14.925114.9250
George WashingtonA1014.8725214.87251
NavyPat14.5925314.59252
BrownIvy14.5425414.54253
ArmyPat14.4925514.49254
BinghamtonAE14.2925614.29256
ManhattanMAAC14.23257114.37255
North Dakota St.Sum14.0525814.05257
QuinnipiacMAAC13.9325913.93258
HowardMEAC13.9126013.91259
JacksonvilleASun13.826113.8260
FordhamA1013.7826213.78261
MercerSC13.7526313.75262
Mount St. Mary'sNEC13.6826413.68264
New OrleansSlnd13.6726513.67265
CharlotteCUSA13.55266110.94306
BucknellPat13.5326713.53266
Eastern IllinoisOVC13.4626813.46267
ChattanoogaSC13.3526913.35268
DetroitHorz13.2527013.25269
Florida Gulf CoastASun13.2227113.22270
Santa ClaraWCC13.1427213.14271
Central ArkansasSlnd13.0127313.01272
Abilene ChristianSlnd12.8727412.87274
PortlandWCC12.8627512.86275
Holy CrossPat12.7727612.77276
Gardner WebbBSth12.727712.7277
St. Francis NYNEC12.6927812.69278
Western CarolinaSC12.6227912.62279
The CitadelSC12.61280112.9273
Tennessee MartinOVC12.5228112.52280
Southern UtahBSky12.4428212.44281
Alabama St.SWAC12.4228312.42282
Sacramento St.BSky12.3328412.33283
DartmouthIvy12.3228512.32284
Morehead St.OVC12.3228612.32285
AmericanPat12.2928712.29286
Texas A&M Corpus ChrisSlnd12.1628812.16287
Little RockSB12.0828912.08288
Prairie View A&MSWAC12.0629012.06289
PittsburghACC11.9129111.91290
Bethune CookmanMEAC11.8529211.85291
Tennessee TechOVC11.8329311.83292
Central ConnecticutNEC11.8129411.81293
SienaMAAC11.8129511.81294
Green BayHorz11.7929611.79295
North Carolina CentralMEAC11.7829711.78296
LafayettePat11.6929811.69297
UMass LowellAE11.5529911.55299
South FloridaAmer11.5130011.51300
UTEPCUSA11.4630111.46301
McNeese St.Slnd11.18302111.67298
Sacred HeartNEC11.1530311.15302
MaristMAAC11.1330411.13303
SamfordSC11.0730511.07304
North Carolina A&TMEAC11.0730611.07305
Loyola MDPat10.8630710.86307
Arkansas St.SB10.7430810.74308
IUPUIHorz10.7330910.73309
New HampshireAE10.6931010.69310
Youngstown St.Horz10.6231110.62311
Norfolk St.MEAC10.5931210.59312
UMKCWAC10.4831310.48313
Western IllinoisSum10.4531410.45314
Arkansas Pine BluffSWAC10.4331510.43315
SouthernSWAC10.431610.4316
RiceCUSA10.3531710.35317
Cal PolyBW10.2631810.26318
StetsonASun10.1831910.18319
Northwestern St.Slnd9.893209.89320
East CarolinaAmer9.873219.87321
Northern ArizonaBSky9.863229.86322
Cal St. NorthridgeBW9.63239.6324
UC RiversideBW9.523249.52325
Savannah St.MEAC9.4932519.81323
UT Rio Grande ValleyWAC9.443269.44326
Cleveland St.Horz9.273279.27327
Houston BaptistSlnd9.013289.01328
Florida A&MMEAC9.013299.01329
Florida AtlanticCUSA9.013309.01330
Maryland Eastern ShoreMEAC8.963318.96331
Delaware St.MEAC8.73328.7332
VMISC8.623338.62333
Kennesaw St.ASun8.533348.53334
MaineAE7.973357.97335
Grambling St.SWAC7.933367.93336
South Carolina St.MEAC7.663377.66337
SIU EdwardsvilleOVC7.53387.5338
Morgan St.MEAC7.393397.39339
Incarnate WordSlnd7.363407.36340
San Jose St.MWC7.263417.26341
PresbyterianBSth7.223427.22342
Jackson St.SWAC7.183437.18343
USC UpstateASun7.053447.05344
BryantNEC73457345
Chicago St.WAC6.613466.61346
Mississippi Valley St.SWAC6.413476.41347
Alcorn St.SWAC5.523485.52348
LongwoodBSth5.173495.17349
Coppin St.MEAC5.163505.16350
Alabama A&MSWAC4.83514.8351

Tuesday, April 3, 2018

Final Add: Bridges Misses MVP by 0.01 after Nova's Dominant Title Game

Villanova's dominant national championship win was led by Mikal Bridges, who increased his Value Add Basketball ranking by 0.21 during the championship win to 10.46 above a replacement player - leaving him one-hundredth of a point per game behind West Virginia's Jevon Carter as the most valuable player in the country according to www.valueaddbasketball.com.

Meanwhile, Villanova Jalen Brunson was solid but in foul trouble during the title game and dropped just slightly from 9.87 to 9.84, still fifth best in the country. National Player of the Year voters selected Brunson as the best player in America - and it is doubtful the team-oriented Villanova would mind an argument about whether Brunson or Bridges was the best player in America of more than 4,000 players.

While Brunson is the best of the three offensively, he takes away only -0.77 points per 100 trips from opponents, while Bridges is coveted by the NBA for his -2.67 defense and Carter barely held on as the Most Valuable Player in the country through an even better -3.12 defense.

However, as great as Bridges defense is, he said during the post-game interview that he sometimes cannot stop teammate Donte DiVincenzo when they practice. DiVincenzo was voted the tournaments most outstanding player in a performance capped by an all-time finals record with 31 points off the bench against Michigan. That final performance moved him from 97th to 70th in the country despite coming off the bench as the Big East's best 6th man.

For Michigan, Moritz Wagner started hot in the championship but tired and dropped slightly from 29th to 31st in the final rating (of more than 4,000 players). His teammate Muhammad-Ali Abdur-Rahkman was fantastic driving paste defenders to move up 12 spots to a final rating as the 57th best player in the country.

While that made for a great duo, no other Michigan player was in the top 250, and as predicted in our projections, they were no match for Villanova, who added the inside dominance of Omari Spellman (77th) and versatile (164th) to give Villanova five players in the top 4% of all players. The only other teams with even four players in the top 4% are Duke, Purdue, and Kansas - so with by far the top duo in the country (no other team had two even in the top 20) and the best top five, it's no wonder www.kenpom.com ranks Villanova as the second best championship team of this century behind only the 2008 Kansas team. In fact, if Memphis had hit any free throws down the stretch in 2008 to deny Kansas the title, Villanova would rate as the best champion of the 21st century.

Here are the new rankings for the Villanova and Michigan players after the championship, with Jevon Carter of West Virginia, left on the list to show how close the final was.

RankPlayerTeamVACorrect
1Jevon Carter #2West Virginia10.47
2Mikal Bridges #25Villanova10.46
5Jalen Brunson #1Villanova9.84
31Moritz Wagner #13Michigan7.98
57Muhammad-Ali Abdur-Rahkman #12Michigan7.26
70Donte DiVincenzo #10Villanova7.04
77Omari Spellman #14Villanova7.01
164Eric Paschall #4Villanova5.99
275Duncan Robinson #22Michigan5.17
355Charles Matthews #1Michigan4.63
430Zavier Simpson #3Michigan4.18
440Phil Booth #5Villanova4.14
659Jon Teske #15Michigan3.30
919Jordan Poole #2Michigan2.43
1028Dhamir Cosby-Roundtree #21Villanova2.17
1053Collin Gillespie #2Villanova2.10
1236Isaiah Livers #4Michigan1.72
1882Ibi Watson #23Michigan0.76
2089Eli Brooks #55Michigan0.55
2203Austin Davis #51Michigan0.46
2327Jaaron Simmons #5Michigan0.37
2563Jermaine Samuels #23Villanova0.24
9999Tim Delaney #34Villanova0.00

Monday, April 2, 2018

SEC, ACC & Big 12 Get Even Stronger with JUCO Commitments to Mississippi, TCU and NC State

To see game-changers for next basketball season, go to Brad Winton's JUCO Report frequently. Based on his scouting, we projected Jeremy Harris would bring a Value Add of 6.0 to Buffalo, and he was even better at 6.19 to rank in the top 4% of all Division 1 players and take Buffalo to the NCAA tournament.

This year the following teams are already getting a boost of at least a point from JUCO transfers who will step on the court ready to play.

SchoolJUCO Boost 2019
Ole Miss6.86
TCU5.5
NC State5
Western Kentucky4.01
Rutgers3.82
Utah3.59
Oklahoma3.06
Mississippi State2.11
Baylor1.74
Dayton1.51
Oregon State1.43
Missouri State1.29
VCU1.22
Boise State1.19
Texas Tech1.11
Wichita State1

Here is Brad's list right now with our Value Add Projections.


RankNameCommittedProjectionHeightSchoolPosition
1Wendell Mitchell6.56'4Trinity Valley CCSG
2Jordan Brangers66'3South PlainsSG
3Yuat AlokTCU5.56'10Chipola PF
4Derek FunderburkeNC State56'10Northwest Florida StateF
5Brian HalumsOle Miss4.56'5Itawamba CCG/F
6Mohamed Thiam4.016'8MarshalltownPF
7Shaq CarterRutgers3.826'9Eastern Florida StatePF
8Trevelin QueenWestern Kentucky3.756'6New Mexico MilitarySG
9Charles Jones JrUtah3.596'3College of Southern IdahoSG
10Ivan Aurrecoechea3.476'8Indian HillsPF/C
11Devante Bandoo3.346'3HutchinsonSG
12Andres Feliz3.196'2Northwest Florida StatePG
13Kur KuathOklahoma3.066'9Salt Lake CCPF
14Roderick Williams2.946'7East LA CollegeG/F
15Isaiah Tisdale 2.826'2Vincennes UniversityCG
16Antun Maricevic2.716'10Casper CollegePF/C
17Marlon Taylor2.556'6Panola CollegeWing
18JJ Rhymes2.456'5HutchinsonWing
19Zach NaylorOle Miss2.366'6Weatherford CollegeG/F
20Tremell Murphy2.26'5Florida SouthwesternWing
21Jethro Tshisumpa MbiyaMississippi State2.116'10San Jacinto CollegeC
22Nick Marshall2.026'11Motlow StateC
23Shane Gatling1.956'4Indian HillsSG
24Ra'Shawn Langston1.876'3Connors StateSG
25Darius AllenBaylor1.746'4Palm Beach StateSG
26Danya Kingsby1.576'2College of Southern IdahoCG
27Jhery MatosDayton1.516'5Monroe CollegeWing
28Kylor KelleyOregon State1.437'0Lane CCC
29Jermaine Haley1.366'7Odessa G/F
30Willesley Butler1.336'8Pensacola StateF/C
31Kabir MohammedMissouri State1.296'5San Jacinto CollegeG/F
32Ricky Torres1.266'3Missouri West PlainsCG
33Corey DouglasVCU1.226'9Tallahassee CCPF
34Pat DembleyBoise State1.196'1Iowa Western CG
35Tray Boyd III1.156'4Northwest Florida StateSG
36Andres Ibarguen1.146'7Trinity Valley CCPF
37Deshawn CorprewTexas Tech1.116'4South PlainsSG
38Rashawn Fredericks1.076'6Motlow StateWing
39Terrell Brown1.066'3City College of San FranciscoSG
40Brian Warren1.045'11Tyler JCPG
41Bushmen Ebet16'3Salt Lake CCSG
42Jaime EcheniqueWichita State16'11Trinity Valley CCC
43Ke'Sean Davis0.976'7Seward CountyG/F
44Quentin JacksonFlorida Gulf Coast0.956'3Tallahassee CCCG
45Ted McCree0.936'4Gillette CollegeSG
46Eli Abaev0.916'8Eastern Florida StatePF
47Canberk Kus0.896'6College of Central FloridaWing
48Mark Gordon0.866'5Daytona StateSG
49Isaiah Crawley0.836'7Columbia StatePF
50Isaiah MauriceNew Mexico0.816'10South PlainsPF
51Darnell BulterFlorida Atlantic0.796'4Seminole StateSG
52Tyler Cheese0.776'3Florida SouthwesternCG
53Javien WilliamsLouisiana Monroe0.746'4Tallahassee CCG/F
54Vinnie ShahidNorth Dakota State0.725'11Western Nebraska PG
55Ahmed AliKent State0.725'10Eastern Florida StatePG
56Austin Trice0.716'7Wabash Valley CollegePF
57Darnell Cowart0.76'8Cowley CountyPF
58Channel Banks0.686'4Sheridan CG
59Kaelin JacksonUMBC0.646'2Temple CollegePG
60CJ Williamson 0.626'6Chipola Wing
61Antonio Williams0.66'2Indian HillsG
62Shamar BaileyPortland State0.566'7Hill CollegeG/F
63Cedric Jackson0.536'4Indian River StateSG
64Jaalam HillCleveland State0.56'7Southwestern Illinois CollegeF
65Will Robinson0.466'5Gulf Coast StateWing
66D'Mauria Jones0.436'4Antelope Valley CollegeWing
67Jeremy Hayes0.396'3Howard CollegeCG
68Xavier Trent0.346'5ClarendonG
69Travis "TJ" Washington0.316'1CoffeyvillePG
70Tyshawn Davis0.286'7Coastal Alabama - MonroevilleF
71Matthew HortonWestern Kentucky0.266'11Shelton StateC
72Victor Curry0.226'7Cleveland StatePF
73Oswald Parker0.26'5BrowardWing
74Robert McCoy0.26'7San Diego CityWing
75Darius WilliamsCal State Bakersfield0.26'8Paris JCPF
76Keandre Cook0.26'5OdessaWing
77Darron Johnson0.26'2Western Oklahoma StateSG
78Edwin Jeudy0.26'7Gillette CollegeF
79Melkisedek MoreauxArkansas Little Rock0.26'7Northeast CCF
80Jamel AllenUMKC0.26'6Indian HillsWing
81Jaiveon Eaves0.26'3John A LoganSG
82Roydell Brown0.26'5Southwest MississippiWing
83Carlos Dotson0.26'7College of Central FloridaPF
84Gilbert Thomas0.26'7Angelina CCPF
85Myron Gordon0.26'3Harcum CollegeSG
86TJ Howard0.26'2ChipolaPG
87Jay'Quan McCloudGreen Bay0.26'2Highland CCSG
88D-Juan Taylor Hodge0.26'4Santa Fe CollegeWing
89Trevais Spencer0.26'4Holmes CCSG
90Reece Brooks0.25'10ClarendonPG
91Randy Miller0.26'2Moberly Area CollegeSG
92Josh Jefferson0.26'2Lake Land CollegeCG
93Jahlil NailsIdaho0.26'5Navarro Wing
94Sayveon McEwen0.25'11Shawnee CCPG
95Irshaad Hunte0.26'7Central WyomingPF
96Kelvin Robinson0.26'4Northwest Florida StateCG
97Marcell Haskett0.26'0New MexicoPG
98Alston Davis0.26'6Cape Fear CCWing
99Derek St HilaireFlorida Atlantic0.26'1Gordon StateCG
100Devin HutchinsonRadford0.26'5Brunswick CCSG


Nova Should Win With 2 of top 5 Value Add Players; While ACC, SEC & B12 Best Top-to-bottom (italics update after Championship)


(see CBS247 Story above by clicking here)

While Villanova puts two of the Top 5 Value Add Basketball players on the court at 9:20 pm Eastern on TBS, strong tournament showings by conferences boosted West Virginia's Jevon Carter (1st overall as National MVP), Georgia's Yante Maten (3rd overall) and Duke's Marvin Bagley (7th, but 1st overall if not injured) in the final ratings. The three Value Add brackets in ESPN's 94th to 96th percentile all point to a Villanova win tonight:

Replaced this paragraph from the original post because the brackets mentioned improved to the 97th to 98th percentile with Villanova's win. Here are all the approaches we laid out, and as you can see those based on www.valueaddbasketball.com with slight variations for other factors all placed near the top and picked Villanova - whereas choosing to go with teams with more NBA talent (Arizona or Kentucky, Duke to win it all etc.) does not work nearly as well as Value Add Basketball. The very best approach was to use the Value Add rankings and make slight adjustments to either go with worse seeds when Value Add said the two teams were within a point of each other (Upset), adjust for the hottest teams between Feb. 1 and the tournament (Hottest) or adjust for the best and most experienced guards (Experienced). www.kenpom.com final ratings calculate Villanova as the second best champion of the century behind only 2008 Kansas.


The second method (hottest) is the only one that projects a closer game - since Michigan is the hottest team in the country - but the fact that Villanova is the only team in the country with four top 100 players (out of 4,068) and has two top five players when no other team has two in the top 20 point to a solid Villanova win.

Team - Top 2 Players Rank and then Names and Jersey Numbers
Villanova, 2 & 5, Mikal Bridges #25, Jalen Brunson #1 (also top 100 Omari Spellman and Donte DiVincenzo)
Duke, 7 & 23, Marvin Bagley #35, Wendell Carter #34
Texas Tech, 17 & 35, Keenan Evans #12, Zhaire Smith #2
Purdue, 27 & 56, Carsen Edwards #3, Dakota Mathias #31
Michigan St., 39 & 58, Cassius Winston #5, Miles Bridges #22
Michigan, 29 & 69, Moritz Wagner #13, Muhammad-Ali Abdur-Rahkman #12
Texas Christian, 40 & 61, Kenrich Williams #34, Vladimir Brodziansky #10

While the Big Ten and Big East (more in-depth Value Add stories on CBS Dodds on Sports) face off for the title after solid tournaments, our in-depth breakdown of every conference from top to bottom shows that of the eight conferences that are at least five points better than the average conference they place right in the middle.

Bad Conference Performances for Pac-12 and American. Meanwhile, Cincinnati's Gary Clark (14th) and Arizona's Deandre Ayton (11th) dropped out of the Top 10 as the American and Pac-12 tournament struggles lowered the calculation on how tough of opponents each had to overcome throughout the season. In the American, 2-seed Cincinnati, 4-seed Wichita State and 6-seed Houston only won two games between them, and Temple was the only conference team invited to the NIT where they lost their opener (albeit to eventual NIT champ Penn State). Seven of the eight Pac-12 teams invited to postseason play lost in either their first NCAA game or second NIT game - with only Utah salvaging some respect with a run to the NIT title game. (Breakdown of every team in every conference here).

ACC, Big 12 and SEC Dominate Top to Bottom. Meanwhile, players surged in the Final Value Add rankings in the three conferences that dominated play. The full-breakdown matching how the No. 1 team in each conference would match up with the No. 1 in the other 31 conferences, and No. 2 vs. No. 2 etc. projects the ACC would be favored in 327 match-ups and underdogs in only 10, with the Big 12 just behind at 282-18 and the SEC at 314-23. While the Big Ten and Big East were next best, top-to-bottom there was a gap between the top three and the Big Ten and Big East, and then between those teams and all the others.

A note: Bagley surged back up to 7th after missing four games due to injury. If he has played all 37 games instead of just 33, his projected Value Add would be 10.80 to make him the most valuable player in the country.


RnkPlayerTeamValueConfHtClass
1Jevon Carter #2West Virginia10.47B126-foot-24 Sr
2Mikal Bridges #25Villanova10.25BE6-foot-73 Jr
3Yante Maten #1Georgia10.24SEC6-foot-84 Sr
4Keita Bates-Diop #33Ohio St.10.06B106-foot-73 Jr
5Jalen Brunson #1Villanova9.87BE6-foot-23 Jr
6Trae Young #11Oklahoma9.73B126-foot-21 Fr
7Marvin Bagley #35Duke9.64ACC6-foot-111 Fr
8Juwan Morgan #13Indiana9.47B106-foot-73 Jr
9Dean Wade #32Kansas St.9.32B126-foot-103 Jr
10Devonte' Graham #4Kansas9.19B126-foot-24 Sr
11Deandre Ayton #13Arizona8.98P127-foot-11 Fr
12John Konchar #55IUPU Fort Wayne8.97Sum6-foot-53 Jr
13Dylan Windler #3Belmont8.94OVC6-foot-73 Jr
14Gary Clark #11Cincinnati8.89Amer6-foot-84 Sr
15James Thompson #2Eastern Michigan8.84MAC6-foot-103 Jr
16Jeff Roberson #11Vanderbilt8.77SEC6-foot-64 Sr
17Keenan Evans #12Texas Tech8.75B126-foot-34 Sr
18Jonathan Stark #2Murray St.8.74OVC6-foot-04 Sr
19Devon Hall #0Virginia8.67ACC6-foot-54 Sr
20Mohamed Bamba #4Texas8.61B126-foot-111 Fr
21Luke Maye #32North Carolina8.58ACC6-foot-83 Jr
22Trevon Bluiett #5Xavier8.55BE6-foot-64 Sr
23Wendell Carter #34Duke8.5ACC6-foot-101 Fr
24Jock Landale #34St. Mary's8.28WCC6-foot-114 Sr
25Shai Gilgeous-Alexander #22Kentucky8.16SEC6-foot-61 Fr

Our forecasts of a Villanova Title were among the 16.3% of all brackets that chose them to win, so a win would improve the three brackets below ahead of even the 96th percentile, 95th percentile and 94th percentile in the current standings. Only 3.8% picked Michigan, so an upset by them tonight could propel many of those brackets above the brackets presented. The 80% of brackets that picked one of the other teams to win the tournament can only drop after tonight's game (rest of blog with average wins picked for every team and updates here).


Team/SeedAve. LinesWin Title
1Villanova3.716.30%
3Michigan2.33.80%
1Kansas3.1
11Loyola-Chicago0.5
1UVA3.4
2UNC2.9
2Duke2.9
3Michigan State2.7
2Purdue2.6
1Xavier2.6
2Cincinnati2.5
4Gonzaga2.2
4Arizona2.1
3Tennessee1.9
3Texas Tech1.7
4Auburn1.5
5West Virginia1.5
4Wichita State1.4
5Kentucky1.4
6Florida1.3
5Clemson1.2
5OSU1.1
6Miami1.0
6Houston0.9
6TCU0.9
10Butler0.8
10Texas0.7
8Missouri0.7
8Creighton0.6
9NC State0.6
10Oklahoma0.6
7URI0.6
7Texas A&M0.6
9Alabama0.6
7Nevada0.6
8Virginia Tech0.6
10Providence0.6
8Seton Hall0.6
9Florida State0.6
7Arkansas0.5
9Kansas State0.5
11San Diego State0.4
12New Mexico State0.4
11Syracuse0.4
11St. Bonaventure0.3
12South Dakota State0.3
12Davidson0.3
12Murray State0.2
14SF Austin0.2
13Marshall0.2
13Charleston0.2
13Buffalo0.1
14Wright State0.1
15Georgia State0.1
13UNCG0.1
14Montana0.1
14Bucknell0.1
16Penn0.1
15CSU Fullerton0.1
15Lipscomb0.1
15Iona0.1
16Texas Southern0.1
16UMBC0.1
16Radford0.1