Thanks readers for informing us the video on this blog was not working. It should be now.
Here is the tracker of all the match-ups in our Statis-Pro league.
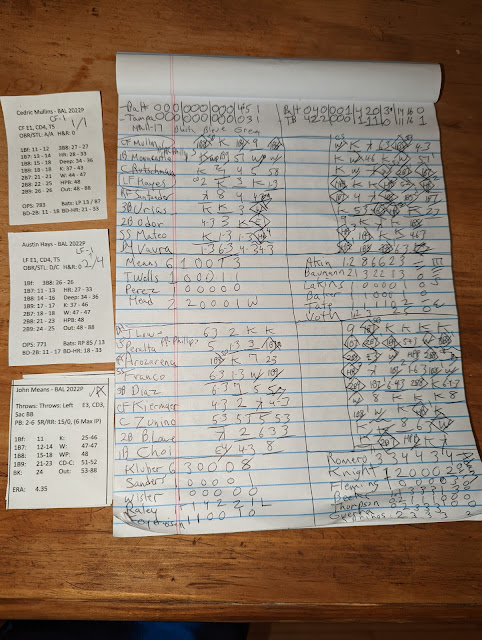
Our fun addition of the Orioles to let every team play an even 10 series results in a lot of runs allowed - they've given up 7.5 runs per game - by far the worst figure in the league. However, it has been feast or famine as the photos at the bottom of this blog show. Their ace Means, while only a PB2-6, went 11 innings and allowed only 2 runs in his first two starts, including 6 scoreless inning against Tampa for the first win of the year - 4-0 in 10 innings on a Mateo grand slam homer.
The Orioles then fought back from down 4-8 for a second thrilling extra inning 14-11 win over Tampa. It doesn't look like either of those two teams will make our 6-team playoff, but we list the standings and where each team ranks in average runs scored and allowed in our season.
First, a video on how I go through my 4-sided deck of fast action cards the 5th through the 8th time.
| Standings | W | L | GB | RS | rnk | RA | rnk |
|---|---|---|---|---|---|---|---|
| Toronto | 27 | 15 | 0 | 6 | 1st | 4.6 | 6th |
| NY Yankees | 28 | 20 | 2 | 4.6 | 5th | 4.1 | 2nd |
| Minnesota | 24 | 18 | 3 | 5.4 | 3rd | 4.5 | 4th |
| Houston | 29 | 25 | 4 | 5.8 | 2nd | 4.9 | 7th |
| Boston | 22 | 20 | 5 | 4.5 | 6th | 3.9 | 1st |
| Cleveland | 21 | 21 | 6 | 4.5 | 7th | 4.4 | 3rd |
| LA Angels | 20 | 22 | 7 | 4.5 | 8th | 5.5 | 10th |
| Chicago ws | 18 | 24 | 9 | 4.4 | 9th | 4.5 | 5th |
| Seattle | 21 | 27 | 9 | 4.8 | 4th | 5.1 | 8th |
| Baltimore | 6 | 12 | 9 | 4.2 | 10th | 7.5 | 11th |
| Tampa Bay | 18 | 30 | 12 | 3.7 | 11th | 5.2 | 9th |

No comments:
Post a Comment