| Conf | Conf Rnk | Natl Rnk | Player | Team | Value Add v5.0 Pts/Game |
|---|---|---|---|---|---|
| A10 | 1 | 12 | Javon Bess #3 | St. Louis | 10.29 |
| A10 | 2 | 66 | Jon Axel Gudmundsson #3 | Davidson | 7.86 |
| A10 | 3 | 105 | Jeff Dowtin #11 | Rhode Island | 7.02 |
| A10 | 4 | 110 | Charlie Brown #2 | St. Joseph's | 6.95 |
| A10 | 5 | 121 | Luwane Pipkins #2 | Massachusetts | 6.83 |
| ACC | 1 | 2 | Zion Williamson #1 | Duke | 11.94 |
| ACC | 2 | 10 | Tyus Battle #25 | Syracuse | 10.43 |
| ACC | 3 | 18 | De'Andre Hunter #12 | Virginia | 9.84 |
| ACC | 4 | 25 | Nickeil Alexander-Walker #4 | Virginia Tech | 9.53 |
| ACC | 5 | 26 | Ebuka Izundu #15 | Miami FL | 9.37 |
| AE | 1 | 107 | Anthony Lamb #3 | Vermont | 6.98 |
| AE | 2 | 179 | Ernie Duncan #20 | Vermont | 6.04 |
| AE | 3 | 227 | Joe Sherburne #13 | Maryland Baltimore Co | 5.64 |
| AE | 4 | 280 | Stef Smith #0 | Vermont | 5.25 |
| AE | 5 | 337 | Akwasi Yeboah #15 | Stony Brook | 4.96 |
| Amer | 1 | 50 | Markis McDuffie #1 | Wichita St. | 8.26 |
| Amer | 2 | 140 | Corey Davis #5 | Houston | 6.51 |
| Amer | 3 | 141 | Terrell Allen #2 | Central Florida | 6.46 |
| Amer | 4 | 178 | Shizz Alston #10 | Temple | 6.05 |
| Amer | 5 | 182 | Aubrey Dawkins #15 | Central Florida | 6.04 |
| ASun | 1 | 139 | Noah Horchler #0 | North Florida | 6.52 |
| ASun | 2 | 148 | Garrison Mathews #24 | Lipscomb | 6.32 |
| ASun | 3 | 162 | Eli Pepper #22 | Lipscomb | 6.15 |
| ASun | 4 | 304 | Zach Cooks #4 | NJ Inst of Technology | 5.1 |
| Asun | 5 | 533 | Jamari Blackmon #3 | North Alabama | 3.95 |
| B10 | 1 | 14 | Lamar Stevens #11 | Penn St. | 10.08 |
| B10 | 2 | 16 | Ethan Happ #22 | Wisconsin | 9.97 |
| B10 | 3 | 17 | Juwan Morgan #13 | Indiana | 9.91 |
| B10 | 4 | 22 | Ignas Brazdeikis #13 | Michigan | 9.57 |
| B10 | 5 | 28 | Jordan Murphy #3 | Minnesota | 9.26 |
| B12 | 1 | 3 | Dean Wade #32 | Kansas St. | 11.94 |
| B12 | 2 | 9 | Dedric Lawson #1 | Kansas | 10.46 |
| B12 | 3 | 11 | Lagerald Vick #24 | Kansas | 10.36 |
| B12 | 4 | 15 | Tristan Clark #25 | Baylor | 10 |
| B12 | 5 | 21 | Christian James #0 | Oklahoma | 9.67 |
| BE | 1 | 4 | Jessie Govan #15 | Georgetown | 11.58 |
| BE | 2 | 7 | Markus Howard #0 | Marquette | 10.69 |
| BE | 3 | 8 | Shamorie Ponds #2 | St. John's | 10.56 |
| BE | 4 | 13 | Myles Powell #13 | Seton Hall | 10.24 |
| BE | 5 | 30 | Sam Hauser #10 | Marquette | 9.08 |
| BSky | 1 | 23 | Michael Oguine #0 | Montana | 9.57 |
| BSky | 2 | 91 | Jerrick Harding #10 | Weber St. | 7.27 |
| BSky | 3 | 154 | Jesse Hunt #34 | Eastern Washington | 6.23 |
| BSky | 4 | 299 | Cameron Tyson #5 | Idaho | 5.12 |
| BSky | 5 | 300 | Sayeed Pridgett #4 | Montana | 5.11 |
| BSth | 1 | 51 | Chris Clemons #3 | Campbell | 8.25 |
| BSth | 2 | 73 | Christian Keeling #11 | Charleston Southern | 7.75 |
| BSth | 3 | 81 | Jahaad Proctor #13 | High Point | 7.5 |
| BSth | 4 | 142 | Scottie James #31 | Liberty | 6.39 |
| BSth | 5 | 317 | Carlik Jones #1 | Radford | 5.05 |
| BW | 1 | 172 | Khalil Ahmad #14 | Cal St. Fullerton | 6.09 |
| BW | 2 | 348 | Dikymbe Martin #15 | UC Riverside | 4.88 |
| BW | 3 | 350 | Mark Crowe #5 | Cal Poly | 4.86 |
| BW | 4 | 449 | Robert Cartwright #3 | UC Irvine | 4.32 |
| BW | 5 | 564 | Jackson Rowe #34 | Cal St. Fullerton | 3.81 |
| CAA | 1 | 35 | Justin Wright-Foreman #3 | Hofstra | 8.73 |
| CAA | 2 | 61 | Grant Riller #1 | Charleston | 7.93 |
| CAA | 3 | 75 | Eric Carter #5 | Delaware | 7.6 |
| CAA | 4 | 147 | Jordan Roland #12 | Northeastern | 6.32 |
| CAA | 5 | 150 | Nathan Knight #13 | William & Mary | 6.28 |
| CUSA | 1 | 34 | Ahmad Caver #4 | Old Dominion | 8.85 |
| CUSA | 2 | 59 | Zachary Simmons #24 | North Texas | 8.09 |
| CUSA | 3 | 69 | Brian Beard #4 | Florida International | 7.77 |
| CUSA | 4 | 106 | Charles Bassey #23 | Western Kentucky | 7 |
| CUSA | 5 | 200 | Tyree Griffin #55 | Southern Mississippi | 5.86 |
| Horz | 1 | 83 | Camron Justice #5 | IUPUI | 7.45 |
| Horz | 2 | 86 | Drew McDonald #34 | Northern Kentucky | 7.43 |
| Horz | 3 | 190 | Tarkus Ferguson #4 | Illinois Chicago | 5.98 |
| Horz | 4 | 241 | Antoine Davis #0 | Detroit | 5.49 |
| Horz | 5 | 277 | Cole Gentry #31 | Wright St. | 5.26 |
| Ivy | 1 | 27 | Matt Morgan #10 | Cornell | 9.34 |
| Ivy | 2 | 38 | Devin Cannady #3 | Princeton | 8.59 |
| Ivy | 3 | 157 | Jordan Bruner #23 | Yale | 6.18 |
| Ivy | 4 | 204 | Justin Bassey #20 | Harvard | 5.83 |
| Ivy | 5 | 298 | Danilo Djuricic #30 | Harvard | 5.12 |
| MAAC | 1 | 68 | Dimencio Vaughn #14 | Rider | 7.81 |
| MAAC | 2 | 173 | Landon Taliaferro #25 | Fairfield | 6.08 |
| MAAC | 3 | 183 | Jalen Pickett #22 | Siena | 6.03 |
| MAAC | 4 | 305 | Marvin Prochet #11 | Niagara | 5.1 |
| MAAC | 5 | 336 | Dominic Robb #32 | Niagara | 4.96 |
| MAC | 1 | 80 | Seth Dugan #50 | Western Michigan | 7.52 |
| MAC | 2 | 108 | Levi Bradley #42 | Northern Illinois | 6.97 |
| MAC | 3 | 109 | Justin Turner #10 | Bowling Green | 6.96 |
| MAC | 4 | 116 | CJ Massinburg #5 | Buffalo | 6.88 |
| MAC | 5 | 143 | Jimond Ivey #0 | Akron | 6.36 |
| MEAC | 1 | 39 | Jermaine Marrow #2 | Hampton | 8.52 |
| MEAC | 2 | 156 | Damni Applewhite #35 | South Carolina St. | 6.18 |
| MEAC | 3 | 189 | RJ Cole #2 | Howard | 5.98 |
| MEAC | 4 | 352 | Randy Miller #11 | North Carolina Central | 4.86 |
| MEAC | 5 | 418 | Malik Maitland #1 | Bethune Cookman | 4.51 |
| MVC | 1 | 135 | Tyreke Key #11 | Indiana St. | 6.56 |
| MVC | 2 | 155 | Cameron Krutwig #25 | Loyola Chicago | 6.21 |
| MVC | 3 | 159 | Phil Fayne #10 | Illinois St. | 6.17 |
| MVC | 4 | 225 | Eric McGill #4 | Southern Illinois | 5.64 |
| MVC | 5 | 271 | Jarred Dixon #11 | Missouri St. | 5.3 |
| MWC | 1 | 33 | Caleb Martin #10 | Nevada | 8.95 |
| MWC | 2 | 64 | Sam Merrill #5 | Utah St. | 7.88 |
| MWC | 3 | 92 | Deshon Taylor #21 | Fresno St. | 7.25 |
| MWC | 4 | 100 | Justin James #1 | Wyoming | 7.04 |
| MWC | 5 | 101 | Cody Martin #11 | Nevada | 7.03 |
| NEC | 1 | 63 | Keith Braxton #13 | St. Francis PA | 7.88 |
| NEC | 2 | 296 | Darnell Edge #1 | Fairleigh Dickinson | 5.12 |
| NEC | 3 | 454 | Tyler Kohl #1 | Central Connecticut | 4.27 |
| NEC | 4 | 511 | Xzavier Malone-Key #5 | Fairleigh Dickinson | 4.04 |
| NEC | 5 | 577 | Chauncey Hawkins #4 | St. Francis NY | 3.76 |
| OVC | 1 | 19 | Ja Morant #12 | Murray St. | 9.83 |
| OVC | 2 | 31 | Nick Mayo #10 | Eastern Kentucky | 9.06 |
| OVC | 3 | 97 | Dylan Windler #3 | Belmont | 7.11 |
| OVC | 4 | 136 | Jason Burnell #14 | Jacksonville St. | 6.54 |
| OVC | 5 | 207 | Caleb Hollander #10 | Belmont | 5.81 |
| P12 | 1 | 6 | Bol Bol #1 | Oregon | 10.83 |
| P12 | 2 | 29 | Tres Tinkle #3 | Oregon St. | 9.15 |
| P12 | 3 | 43 | Nick Rakocevic #31 | Southern California | 8.41 |
| P12 | 4 | 60 | KZ Okpala #0 | Stanford | 8.07 |
| P12 | 5 | 77 | Jaylen Nowell #5 | Washington | 7.57 |
| Pat | 1 | 164 | Kyle Leufroy #2 | Lehigh | 6.12 |
| Pat | 2 | 171 | Matt Wilson #14 | Army | 6.09 |
| Pat | 3 | 193 | Pat Andree #31 | Lehigh | 5.92 |
| Pat | 4 | 205 | Jehyve Floyd #20 | Holy Cross | 5.82 |
| Pat | 5 | 267 | Max Mahoney #51 | Boston University | 5.34 |
| SB | 1 | 32 | Nijal Pearson #22 | Texas St. | 8.98 |
| SB | 2 | 55 | Zac Cuthbertson #40 | Coastal Carolina | 8.15 |
| SB | 3 | 70 | Ty Cockfield #0 | Arkansas St. | 7.77 |
| SB | 4 | 99 | Jakeenan Gant #23 | Louisiana | 7.05 |
| SB | 5 | 112 | Malik Benlevi #2 | Georgia St. | 6.94 |
| SC | 1 | 5 | Matt Rafferty #32 | Furman | 10.84 |
| SC | 2 | 125 | Kyrin Galloway #14 | North Carolina Greensboro | 6.8 |
| SC | 3 | 158 | Francis Alonso #10 | North Carolina Greensboro | 6.18 |
| SC | 4 | 263 | Jeromy Rodriguez #11 | East Tennessee St. | 5.36 |
| SC | 5 | 270 | Djordje Dimitrijevic #0 | Mercer | 5.32 |
| SEC | 1 | 1 | Grant Williams #2 | Tennessee | 12.16 |
| SEC | 2 | 37 | Mark Smith #13 | Missouri | 8.6 |
| SEC | 3 | 41 | Chuma Okeke #5 | Auburn | 8.45 |
| SEC | 4 | 79 | Quinndary Weatherspoon #11 | Mississippi St. | 7.54 |
| SEC | 5 | 82 | Jared Harper #1 | Auburn | 7.46 |
| Slnd | 1 | 134 | DeAndre Jones #55 | Central Arkansas | 6.56 |
| Slnd | 2 | 199 | TJ Atwood #15 | Lamar | 5.88 |
| Slnd | 3 | 233 | Myles Smith #2 | Texas A&M Corpus Christi | 5.56 |
| Slnd | 4 | 265 | Nathan Bain #23 | Stephen F. Austin | 5.34 |
| Slnd | 5 | 284 | Eddy Kayouloud #14 | Central Arkansas | 5.23 |
| Sum | 1 | 24 | Mike Daum #24 | South Dakota St. | 9.56 |
| Sum | 2 | 47 | Trey Burch-Manning #12 | South Dakota | 8.34 |
| Sum | 3 | 88 | Zach Jackson #21 | Nebraska Omaha | 7.37 |
| Sum | 4 | 195 | Kobe Webster #10 | Western Illinois | 5.91 |
| Sum | 5 | 307 | John Konchar #55 | Purdue Fort Wayne | 5.09 |
| SWAC | 1 | 246 | Trayvon Reed #5 | Texas Southern | 5.47 |
| SWAC | 2 | 249 | Deshaw Andrews #12 | Alcorn St. | 5.46 |
| SWAC | 3 | 281 | Martaveous McKnight #23 | Arkansas Pine Bluff | 5.24 |
| SWAC | 4 | 623 | Gary Blackston #3 | Prairie View A&M | 3.58 |
| SWAC | 5 | 719 | Charles Jackson #1 | Arkansas Pine Bluff | 3.26 |
| WAC | 1 | 180 | Lesley Varner #11 | Texas Rio Grande Valley | 6.04 |
| WAC | 2 | 213 | Conner Toolson #11 | Utah Valley | 5.78 |
| WAC | 3 | 259 | Xavier Bishop #0 | Maryland Kings Co | 5.37 |
| WAC | 4 | 260 | Jake Toolson #2 | Utah Valley | 5.37 |
| WAC | 5 | 402 | Milan Acquaah #0 | Cal Baptist | 4.59 |
| WCC | 1 | 20 | Brandon Clarke #15 | Gonzaga | 9.72 |
| WCC | 2 | 54 | Jordan Ford #3 | St. Mary's | 8.17 |
| WCC | 3 | 58 | Isaiah Pineiro #0 | San Diego | 8.09 |
| WCC | 4 | 62 | Zach Norvell #23 | Gonzaga | 7.91 |
| WCC | 5 | 74 | Yoeli Childs #23 | Brigham Young | 7.63 |
Tuesday, December 4, 2018
Value Add top 5 players in each conference
We debut the 2018-2019 Value Add Basketball rankings with more than 4000 players rated. You can click here to sort all players, and below are the top five players to date in each conference. Congrats to Cal Baptist and North Alabama for getting player's in their conference top fives in their first month at the D1 level.

Monday, December 3, 2018
Additional History on Dodds On Sports Story on Marquette Value Add Rankings
Duke has had more seasons (4) with more than two players in the top 1% than all other schools combined going back to the 2001-2002 season in the database. The only other schools were Illinois,
Villanova, and Baylor - who was unluckiest of all teams since their 2010 team with three players in the top 1% lost to Duke’s 2010 team with the same. Duke also had three players in the top 1% in 2002 and 2004, and their 2015 team that beat Kentucky is the only team in history to have four players in the top 1%.
On average, just three teams a season have two players in the top 1%. While Travis Diener and Dwyane Wade were clearly the top MU duo of the century, the actually never did in the same
season and Diener did not crack the top 1% until 2004 and 2005, the two years after Wade. Both players nearly missed being rated by Value Add as the top player in the nation their final season. In addition to Wade’s 2003 Final Four season, Diener was actually the most valuable player in the country for the 23 games he played - rating ahead of Andrew Bogut, JJ Redick and Chris Paul - with
a rating of almost 13.0 Points Above Replacement or Value Add. However, Value Add awards a player a 0.0 value every time his team plays without him, so that weighted him down to a 9.74 for the season, still the 11th best total player but slightly off his junior mark that placed him 7th.
As for the time the Chicago Bulls called, it was Matt Lloyd, who was called the “Bulls eye for talent” in this media story, who called. Lloyd was not surprised I ranked Lazar Hayward in the top 1% his senior year, but was stunned Jimmy Butler ranked as the 5th most valuable player in the country when he averaged just 14.7 points per game. Another time I met him at the Bradley Center because a guy was visiting who Value Add said could be a bench player in the NBA - Norfolk State’s Kyle O’Quinn, who nearly stunned Marquette that night, and did stun Missouri in March Madness as a 15-seed later in the year, and Lloyd moved onto the Orlando Magic and picked him up as well.
It is early in the season, and there is no guarantee where the Hauser brothers and Howard will finish playing on a team with the kind of balance that has been missing for several years (as-in, no one is pushing our bigs around any more and if you want to guard the three-pointer Sacar Anim might just take you to the rim every time. However, sometimes the Value Add calibrations point to potential history to be made, and a duo that ranks even with Butler and Hayward and behind only Wade and Diener, and with a little brother that ranks in the top few freshmen of the century certainly holds out
hope.
Sunday, December 2, 2018
Statis Pro Baseball - Instructions to Learn to Play Basic Game in 5 Minutes (video added)
On August 14, 2026 we updated the chart for runners advancing an extra base on a hit, and you can use just 1-sided die so 1 = 11-18, 2 = 21-28 etc. The 2026 player cards are here: https://docs.google.com/spreadsheets/d/1xHl7A4igsjaab7zY8Vthia4RTA4QYrGdq0_DQ1k0aF0/edit?usp=sharing

Click here for links to all the current players as well as the 60 all-time great Statis-Pro baseball teams. Each team has simplified rules listed under the players, so you can play a game you need nothing more than to print two teams, and get two 6-sided dice and two 8-sided dice of different colors.
We consolidated various sets of instructions on Statis-Pro Baseball game into the following.
You can also read these instructions in this updated grid. We this have this google sheet which also includes all of the great team pitchers and hitters, but most find it much easier to use the link to the PDF versions above. Also here is a fun optional Z-Play chart with more than 400 unusual plays to amuse the less diehard fan but also teach even the veteran more obscure rules.
If you do not want to keep track of the advance charts to take extra bases on hits or steal bases in Statis-Pro Baseball (http://www.pudnersports.com/2018/12/link-to-learn-statis-pro-in-5-minutes.html), we have added this simplified chart so you can use just an 8-sided die or the first digit of the 11-88 Random No.

We consolidated various sets of instructions on Statis-Pro Baseball game into the following.
2. Player Cards 2Setting Up 42-12 number: 4Left vs. Right Adjustment 12/88, 88/11 or other. 5Chance of Error on Hit or Out 6SR and RR - How Long Can a Pitcher Pitch Before Getting Tired? 10Optional Advanced Rules 13Clutch Fielding (CD or for catcher CD-C): 14Statis-Pro Baseball was invented by Jim Barnes in 1970, and in an interview he invited others to adopt and update the game as “open source.” Our free version enables you to either play current teams with projected players, or to choose from 60 all-time great baseball teams. There is a complete game and many seasons of great advanced Statis-Pro cards on the Statis Pro Advanced Facebook page, if you want to try the game here first and consider ordering from them if you determine you like it.
Basic Understanding of the Game
The unique aspect of the game is that each plate appearance starts by determining if the pitcher is in control of the at-bat and his card will be used, or if he “makes a mistake” to put the action on the batter’s card and give him a chance for an extra base hit. An initial roll of two-tradition 6-sided dice or a use of “fast action cards” yield a number of 2-12. The best pitchers keep it on their card on 2-9, while the worst pitchers only control the action on a 2-4. Once you know whether the batter or pitcher card will be used for that at bat, a subsequent roll of two 8-sided dice for a result of 11-88 or a similar number from the fast action card gives the result of the plate appearance.
Dice or Fast Action Cards.What you need to play
You need one of the three things in these photos. If you choose to use dice, you need two traditional 6-sided dice, two 8-sided dice of different colors, and one 20-sided die. If you prefer to use the free fast action cards we provide, they look like the all-white card below. Others sell much nicer fast action cards, so google “statis-pro baseball fast action cards” and you can find a set for $10 - you can see the blue and green corner of one of those cards and they really do add to the game..

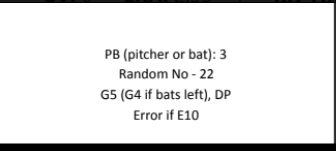
Player Cards
Next, choose the teams you want to play. If you want to play two of the 60 all-time great teams, print the pitchers (see 1995 Braves below) from this pdf (one team to a page) and then follow these directions to print out the batters (see 1927 Yankees below) from a google sheet. If you prefer to play modern players, then choose the pages of the teams you want from all 2022 Projected Batters (49 pages, 9 cards to a page) and All 2022 Projected Pitchers (62 pages, 9 cards to a page) - the cards will have ranges like the Scherzer vs. Betts cards below. So you will be using EITHER team sheets of players or individual cards of players.


How to Play the Game
Setting Up
Choose a player on each team to pitch and play the other 8 positions - C, 1B, 2B, 3B, SS, LF, CF and RF. Next choose if you will use an extra batter as a designated hitter (DH) or have pitchers hit in the game. Once you choose the 9 who will start the game, write them down in the order they will hit from 1st through 9th.
If you are using cards you can shuffle them, but if you printed out our free ones, you may just want to put them all in a big bowl to pull out the cards one at a time. Of course, if you are using the five dice then no shuffling is needed.
If you are using player cards, you can stack the line-up in order. If using team sheets, you may want to use a couple of business cards to put below each batter as they hit.
Order of Play
2-12 number:
Get a result of 2-12 from flipping a card or rolling the dice. If that number falls within the pitcher’s PB rating (pitcher or batter) then the action will occur on the pitcher’s card, and if outside that range it will occur on the batter’s card. The possible PB ranges on pitchers’ cards, from best to worst, are 2-9, 2-8, 2-7, 4-7, 2-6, 2-5 or 2-4.
If you choose to use optional advanced rules, look at the bottom of these rules for CD, BD or Z-plays, which can occur in place of the 2-12 number.
11-88 number - 11 possible results (hits, balks, Ks, Walks, HBP, WP, PB, Out)
On the 2nd card, read the second number (Random Number 11-88) to see what happens on that card, or look at the 8-sided dice for the 11-88 number.. (If noone is one base, change any BK, WP or CD on line 2 to an OUT).
Here are the 10 possible results:
1B = Single
2B = Double (only on batters' cards)
3B = Triple (only on batters' cards)
HR = Home Run (only on batters' cards)
BK = Balk if anyone on base (only on pitchers' cards, if no one on base treat as OUT)
K = Strikeout
W = Walk
CD-C = Catcher Clutch Defense - if not using advanced rules treat as out
HPB = Hit by Pitched Ball (only on pitchers' cards)
WP/PB = Wild Pitch or Passed Ball (only on pitchers' cards, if no one on base treat as OUT)
Out = see below.
If using player cards, the card will also indicate the fielder who gets the ball on a single (1Bf, 1B7, 1B8 or 1B9) or double (2B7, 2B8, 2B9). If using a sheet, the reading is simply 1B or 2B so use the second digit of the number to determine the field. A 1 or 2 (11, 12, 21, 22 etc.) indicates the batter pulled the ball, so a RN or RP hits it to LF, a SN, SP or P to CF and a LN or LP to right. If the last digit is 3 or 4, the hit goes to LF, 5 or 6 goes to CF and 7 or 8 goes to RF.
On old fast action cards, you would check after a WP or BK for a “yes” or “no” result, but skip that step even if using those old cards. If anyone is on base, the WP or BK occurs if it comes up on the card.
Left vs. Right Adjustment 12/88, 88/11 or other.
The Cht numbers at the bottom right of the batter card indicates numbers on which results are adjusted based on if the opposing pitcher is right-handed or left-handed. The standard 12/88 for a left-handed batter indicates that an 11 or 12 is changed from a hit to a strikeout against a left handed pitcher, and an 88 is changed from an out to a single with runners advancing two bases against a right-handed batter. The standard right-handed batter has an 88/11 meaning an 88 against a left-handed pitcher is a single, runners advance two bases while an 11 is changed to a strikeout against a right-handed pitcher. Typically a switch-hitter is –/– meaning no adjustment.
For some batters there are more numbers impacted, for example a 14/85 would be the most extreme possible adjustment, and mean the batter struck out on 11-14 against lefties, and had singles with runners advancing 2 bases on 85-88. Just remember the number to the left of the dash is the adjustment against lefties, and the number to the right of the dash is the adjustment against righties. Further, the number either goes all the way down to 11, or all the way up to 85 from what is listed.
If Result is OUT:
If the result is an OUT, the fast action cards we provide will tell you what type of out is made.
If using the nice Fast Action Cards you produce then the following will tell you what happens to runners on base.
G6A (grounder to short) or any other A at the end of a grounder tells you the batter is out, but all runners advance.
Gx6 or any other reading with an x in the middle indicates runners hold and if there is a force out then the defense can throw out a forced runner. However, if runners are on 1st and 3rd then the defense must choose whether to take the out at second base and let the runner on third score or hold the runner at third and throw out the batter to leave runners on 2nd and 3rd.
G6 or any other reading with no x or A indicates a double play grounder if a runner is on 1st. However, if there is a runner on 3rd and no outs, the defense needs to either hold him and just throw the batter out at 1st, or let him score and turn the double play. If bases are loaded with no outs, the defense can choose to either throw the runner out at home, or take the double play from 2nd to 1st and let him score.
Chance of Error on Hit or Out
An error can occur under any of the three systems you can use for random numbers.
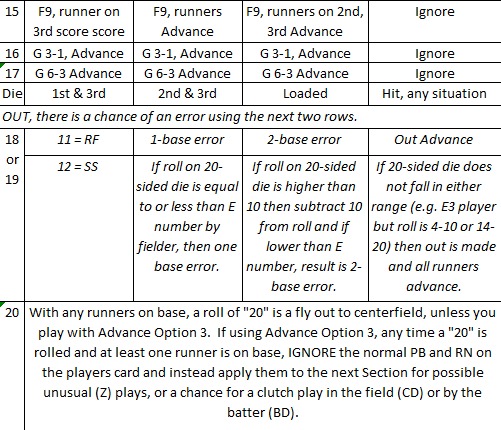
If using dice, any time a 18 or 19 on the 20-sided die is rolled there is a chance for an error. On a hit, the outfielder who fields the ball could make an error to allow an extra base on the hit, while on an Out the player could allow a 1- or 2-base error instead of an out.
On the nice Fast Action Cards you can buy from someone, a * will appear by the out result to let you know to check for errors on the next card. When using those cards, check for an error only on hits on the batter’s card - there is no chance of an error on a hit off the pitcher’s card.
If using the free fast action cards we provide, the Error Reading on the 4th card is only used if; there is a hit on the BATTER card on line 2 OR, there is a possible error (e?) on line 3 with an out. If the fielder's E number is in the range on this 4th line then everyone is safe in an out or gets an extra base on a hit. Flip for another 11-88 and if the number is 61-88 give batter and runners one additional base for a throwing error.
Once you determine a player who might make an error - E-0 to E-10
If there is a chance of an error on a player, then the next fast action card will determine if the error is in the player's range. A player can have anywhere from an E-0 (the best, never makes an error) to the worst E-10. If using the fast action cards, the next card will tell you if the error is in that range (e.g. Error 3-10 would be an error for an E-3 but not for an E-2).
If using dice, the 20-sided die determines the same thing with a roll of 3 meaning the same as a 3-10 range is an error. If the roll is 10 or higher, then subtract 10 but if it is an error then it is in the range. So a 13 die roll would be a 2-base error for an E-3, but no error at all for an E-2.
Obviously you cannot have a double play with noone on base, pardon the type under “1” with bases empty, just a grounder from shortstop to first base.


SR and RR - How Long Can a Pitcher Pitch Before Getting Tired?
The SR number is used for a starting pitcher, and RR used for a relief pitcher to see when they tire in a game.
For example, Greg Maddux on the sheet above would start at 15 or his SR.
This number is lowered by 1 every time the pitcher:
Allows a runner to reach 1st base (unless on an error that is not his fault)
Allows an earned run
An inning ends while he is pitching (whether he started that inning, or cam in after it started)
Once a pitcher’s SR or RR is reduced to 0, his PB drops by 1, and then every additional education from one of those three occurs it is reduced by one more. If a pitcher started with the best rating of PB 2-9, then when he hit zero he would drop to PB 2-8, and then to 2-7, 4-7, 2-6, 2-5, 2-4, 2-3, 2-2 and if reduced further then the rest of the batters faced would skip the 2-12 number and automatically go to the 11-88 on the batter’s card.
Taking Extra Bases on Hits, Hit and Runs, or Bunts
Normally after getting the result you move onto the next batter. However, you can opt for any of the following strategies to advance base runners rather than going immediately to the next batter and the next 2-12 number.
Here are charts with various options. Note I have made some changes in writing after reviewing stats on frequencies of various scenarios.
On bunts, we do have some all-time great players whose Sac (bunt) rating is AA+. The first time an AA+ player bunts in a game, use the AA column on the sacrifice chart BUT on an 11-28 he is safe at first base on a single.
When a runner tries to take an extra base on a hit, the chart is used for the numbers on which he makes it to the next base. However, in some cases he cannot make it the extra base, but he is not thrown out either, he just sees a strong throw coming and stops at the base. He is only thrown if the 11-88 number for the throw is a 71-88 from a T-5 throwing arm for the outfielder, or a 75-88 for T-4, 81-88 for a T-3 and finally 85-88 for a T-2. Players advancing or being thrown out in modern baseball is even more rare, with layers taking the next base only 30 percent of the time and only being thrown out 1 percent of the time.


Optional Advanced Rules
You can choose to ignore a BD, CD or Z-play result to keep the game simple. If so, just ignore and play the 2-12 range to use the batter or pitcher card instead.
If you choose to play the advance rules, these can come up instead of the 2-12 number in the following ways.
If using dice, a roll of 20 on the 20-sided dice can overrule the 2-12 rating only if runners are on base.
If using fast action cards, in some cases a BD, CD or Z will come up instead of a 2-12 on some cards. With Fast Action Cards, Z-plays do happen even if noone is on base, but BD or CD is skipped if noone is on base.
Clutch Batting (BD):
If at least one runner is on base and the results is BD, or clutch batting, then the 11-88 number results in one of the following:
If the number would result in a 1B on the batters cards, then make the result is a 2B (double) and all runners on base score.
If the number would result in a 2B, 3B, HR or Deep on the batters card, then change to a home run.
If the number would have resulted in anything else on the batters card, then change to a foul ball, and the batter is still at the plate.
Clutch Fielding (CD or for catcher CD-C):
If the result is a CD-C then use the catcher's clutch defense rating from 1 to 5 but simply score as an Out if noone is on base. If a CD results and anyone is on base, then check to see which fielder has a chance to make a play. The fast action card will indicate which player, but if using dice then refer to the 2-12 number to determine the player. If are using dice to determine which player has a chance for a clutch defensive player, or might commit and error - then use the following numbers:
2 or 3 = 1B, 4 = P, 5 = CF, 6 = 3B, 7 or 12 = SS, 8 = 2B, 9 - LF, 10 = C, 11 = RF.
Once you know the position, use that players CD rating of 1 to 5 then the 11-88 number on the chart below:
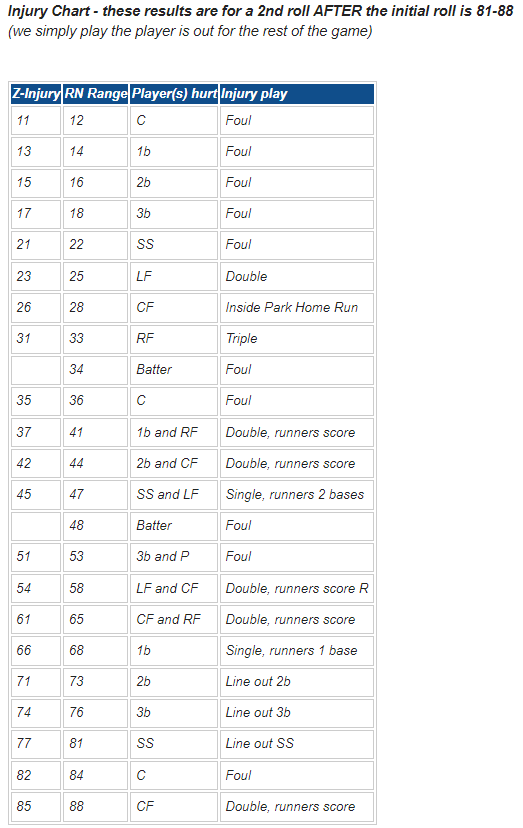
Z-Play - unusual plays, injuries and tough fielding plays:
The following charts are used if an unusual “Z-Play” occurs. Draw a new 11-88 number.

Statis-Pro Baseball: 6 International Teams to Print and Play
You can view and sort Statis-Pro baseball cards based on projected pitching, fielding and batting stats for everyone from upcoming 19 year old rookie Vlad Guerrero to just retired Ichiro. You can sort and update by current major league teams, or any other way you want to group players. As another option, we picked six international all-start teams with suggested line-ups and pitching rotations and inserted them below, so you can print on each of the six teams below for an off season international challenge. Learn to play Statis-Pro Baseball in 5 minutes by clicking here.
Here are the actual season updates.
The following are the actual player cards, listed in row form. The first nine batters for each of these teams are in order our suggested line-up, so for Canada we suggest batting Ozzie Albies first, Vladimir Guerrero Jr. second etc. Several bench players are listed next. Then we list our suggestion for four players in a pitching rotation, then the relievers are listed from best to worst. We will post a breakdown of the US-born players separately.


Here are the actual season updates.
| International | Starters ERA | Pitch | Line-ups OPS | Bat | Overall Rating | Seed | |
|---|---|---|---|---|---|---|---|
| Dominican Republic | 3.69 | 6.5 | 0.812 | 8.8 | 15.4 | 1 | |
| Venezuela | 3.47 | 8.1 | 0.787 | 6.2 | 14.3 | 2 | |
| Canada/Netherlands | 3.97 | 4.5 | 0.771 | 4.6 | 9.1 | 3 | |
| Japan/Korea | 3.77 | 6 | 0.727 | 0 | 6.0 | 4 | |
| Cuba | 4.61 | 0 | 0.773 | 4.8 | 4.8 | 5 | |
| Puerto Rico | 4.56 | 0.4 | 0.750 | 2.4 | 2.7 | 6 |
The following are the actual player cards, listed in row form. The first nine batters for each of these teams are in order our suggested line-up, so for Canada we suggest batting Ozzie Albies first, Vladimir Guerrero Jr. second etc. Several bench players are listed next. Then we list our suggestion for four players in a pitching rotation, then the relievers are listed from best to worst. We will post a breakdown of the US-born players separately.
Statis-Pro: 8 USA Teams and 6 International Teams Compete
The 2019 Statis-Pro baseball cards can be sorted by MLB team and used to play the free Statis-Pro baseball game, however in the off season we sorted by birth place and picked all-stars from each region. Learn to play Statis-Pro Baseball in 5 minutes by clicking here.
For the American-born players, we picked the best players from the three states that produce the most talent - Florida, California and Texas - and then grouped the other teams by which of the big five college conferences is the big one where they are born. For example, Justin Verlander played for Old Dominion University but because he was born in my home town of Richmond, VA I consider him in the ACC region so he is there ace.
I then divided the non-USA players by country, with the Dominican Republic and Venezuela being the biggest producers of talent in that order and Puerto Rico and Cuba needed just a few players to complete their rosters. I needed to group Japan and South Korea for an Asian level team and did get a couple of Asian-Americans born in Hawaii to complete their roster as they are pitching rich but hitting light, and finally I grouped a Northern team from north of the 50th parallel made up mainly of players born in Canada or the Netherlands and let them have a few players from the Netherlands one former island in the Caribbean as well.
To give an idea of how strong every region is, I graded all 14 teams based on the OPS of their starting line-up, and the ERA of their starting rotation - giving the best a "10" and the worst a "0" in each category so each team could have an overall rating of 0 to 20.
Florida edged out California as the top overall team with a 3.20 ERA and 0.809 OPS for 18.5 out of 20 points. However, California had the best batting with an 0.823 OPS to be taken as my 2nd seed. Florida will get the Pac12 in a 1 v 8 series in my tournament, as the Pac12 really was cheated since the California players, and then California will get the Big Ten in a 1 vs 7 "Rose Bowl" type series:
On the International side the Dominican Republic and Venezuela are the class of the world, not producing quite as high marks as the teams of Californians and Floridians, but about as much as the entire SEC states outside of Florida. On the international front, I'm actually playing off a mini season.
For the American-born players, we picked the best players from the three states that produce the most talent - Florida, California and Texas - and then grouped the other teams by which of the big five college conferences is the big one where they are born. For example, Justin Verlander played for Old Dominion University but because he was born in my home town of Richmond, VA I consider him in the ACC region so he is there ace.
I then divided the non-USA players by country, with the Dominican Republic and Venezuela being the biggest producers of talent in that order and Puerto Rico and Cuba needed just a few players to complete their rosters. I needed to group Japan and South Korea for an Asian level team and did get a couple of Asian-Americans born in Hawaii to complete their roster as they are pitching rich but hitting light, and finally I grouped a Northern team from north of the 50th parallel made up mainly of players born in Canada or the Netherlands and let them have a few players from the Netherlands one former island in the Caribbean as well.
To give an idea of how strong every region is, I graded all 14 teams based on the OPS of their starting line-up, and the ERA of their starting rotation - giving the best a "10" and the worst a "0" in each category so each team could have an overall rating of 0 to 20.
Florida edged out California as the top overall team with a 3.20 ERA and 0.809 OPS for 18.5 out of 20 points. However, California had the best batting with an 0.823 OPS to be taken as my 2nd seed. Florida will get the Pac12 in a 1 v 8 series in my tournament, as the Pac12 really was cheated since the California players, and then California will get the Big Ten in a 1 vs 7 "Rose Bowl" type series:
| All-Star Team | Starters ERA | Pitching 0-10 | Line-ups OPS | Batting 0-10 | Division | Overall Rating | Seed |
|---|---|---|---|---|---|---|---|
| Florida | 3.20 | 10 | 0.809 | 8.5 | USA | 18.5 | 1 |
| California | 3.49 | 8 | 0.823 | 10 | USA | 17.9 | 2 |
| SEC | 3.24 | 9.7 | 0.780 | 5.5 | USA | 15.2 | 3 |
| Texas | 3.80 | 5.8 | 0.796 | 7.2 | USA | 12.9 | 4 |
| Big 12 | 4.02 | 4.2 | 0.810 | 8.6 | USA | 12.8 | 5 |
| ACC | 3.72 | 6.3 | 0.786 | 6.1 | USA | 12.5 | 6 |
| Big Ten | 4.01 | 4.3 | 0.805 | 8.1 | USA | 12.4 | 7 |
| Pac 12 | 3.79 | 5.8 | 0.729 | 0.2 | USA | 6.0 | 8 |
On the International side the Dominican Republic and Venezuela are the class of the world, not producing quite as high marks as the teams of Californians and Floridians, but about as much as the entire SEC states outside of Florida. On the international front, I'm actually playing off a mini season.
| International | Starters ERA | Pitching 0-10 | Line-ups OPS | Batting 0-10 | Division | Overall Rating | Seed |
|---|---|---|---|---|---|---|---|
| Dominican Republic | 3.69 | 6.5 | 0.812 | 8.8 | International | 15.4 | 1 |
| Venezuela | 3.47 | 8.1 | 0.787 | 6.2 | International | 14.3 | 2 |
| Canada/Netherlands | 3.97 | 4.5 | 0.771 | 4.6 | International | 9.1 | 3 |
| Japan/Korea | 3.77 | 6 | 0.727 | 0 | International | 6.0 | 4 |
| Cuba | 4.61 | 0 | 0.773 | 4.8 | International | 4.8 | 5 |
| Puerto Rico | 4.56 | 0.4 | 0.750 | 2.4 | International | 2.7 | 6 |
Subscribe to:
Posts (Atom)