Saturday, July 6, 2019

Dominican Stars Help Padres beat over achieving Giants with new free Statis-Pro cards and Game Rules

Dominican-American Super start Manny Machado homered to help the Padres improve to 2-1 with the Padres Dominican Dinelson Lamet in the Statis-Pro board game. The Dominican Republic already won the international season in the game - but the addition of Machado help the Padres become a contender in real life and in the game based on the Power Ratings and click here for our MLB rosters.

Here are the standings as we start the next round of NL Statis-Pro games with new player cards and a few new rules in use. This next round started with the Padres beating the overachieving Giants twice to knock them out of a 3-way tie with the heavily favored Dodgers (ranked tied in first with the Yankees for best overall Statis-Pro cards) and the Diamondbacks.

While more than 11,000 have visited the instructions for how to play the basic version of the game with the cards provided, we do continue to suggest you try these as your free version and then order the great cards from the Advanced Statis-Pro Facebook page (we are not connected with them, only believe they have the best player cards we have seen and ordered).

The Braves and Cubs led the other two divisions while the Giants and Diamondbacks would play in the wild card game if the season ended today. However, the Power Rankings make it look like the Nats and Phillies are the favorites to end up as the two wild card teams. the standings and a sentence on each game played are recorded on this google doc. (My friend is playing the AL this year, as we rotate each year).

NL WestWLGB
Dodgers23130
Giants2016-3
Diamondbacks1917-4
Padres1917-4
Rockies1119-9
NL CentralWLGB
Cubs20100
Brewers1515-5
Pirates1416-6
Cardinals1620-7
Reds1620-7
NL EastWLGB
Braves19110
Nationals2115-1
Phillies1614-3
Mets1515-4
Marlins1020-9

The changes we made once every team had played 10 games, and some basic rules:

For the first time in current play in my decades of playing, we have added the PB: 4-7 and PB: 2-4 cards - something we've already used playing the great all-time teams provided via the Statis-Pro Advanced Facebook page. I go through an pretty exhaustive breakdown of how I distribute the park neutral PB ratings here.

Due to a shortage of pitchers, we experimented with international rules the first 10 games of the season -starting players on 1st and 2nd base each extra inning and letting the 9th inning pitcher stay in the game to play it out. It was a fun twist, but now that each team has plenty of pitchers on the google sheet of players and the fact that teams will get down to PB2-4 pitchers to make runs more likely as it goes deeper in extra innings we are now playing normal MLB rules for each game.

In addition to his great cards, we noted that the Advanced Statis-Pro facebook provider also changed the left-right match-ups so that you only change the Random numbers of 11 or 12 to outs in a lefty vs lefty match-up, and only change one number in the other combinations (righty vs. righty is changed to strikeout only on an 11, while the advantage of left vs. right no matter which the batter is and which the pitcher is now is only changed on a random number of 88 - turning from an out to a single with runner advancing two bases.

Because the free player sheets we provide only tell you if something is a single or double and not which field the ball is hit to like the actual player cards provided on the Facebook page - the direction of the hit is determined by the last digit of the random number on the card:

11 = if the batter is an OBR A or B then check the next number for the CD to determine which of the 9 fielders played the single - this is the only chance for an infield singled but it could go to the outfielder. Otherwise:

The batter pulls the single or double if the last digit of the random number is a 1, 2 or 3 (11, 12, 13, 21, 22, 23, 31, 32, 33, etc.

All batters hit the ball to centerfield if the last digit is a 4, 5 or 6 (14, 15, 16, 24, 25, 26, etc.).

The batter his the ball to the opposite field if the final digit is a 7 or 8 (17, 18, 27, 28, etc.)

When a clutch batting (BD) is drawn with someone on the base and a projected card that does not have BD ranges then we use the batters card and make the following conversions:

1B - becomes base clearing double
2B - becomes home run
3B - stays triple
HR - stays home run
K - stays strike out
W or HPB - change to foul and draw RN again for BD until you get another result
Out - deep drive caught but all runners move up a base.

Each game still counts as a three-game series with the winner normally getting credit for 2 wins and the loser 1 win. The exception is if one team has a 5-run lead at the end of the 8th inning without using their closer through eight and they need to just hold the lead in the 9th.

Season summaries starting with 11th game for each team. The summaries of the first 92 games played in this season are tracked in this google doc with the 93rd and 94th games recorded below with the  - San Diego vs. San Francisco series.


SD beats SF 2-1 (paddock vs. Lamet) The 1st "average" pitcherwith a PB4-7, Suerez did his part with only 1 run allowed through 5 IP , but in the7th Machado GW -1b gave Padres 2-1; overachieving Giants fell from 3-way tie for 1st.

SD beats SF 6-3 (Suerez vs. Samardzija) Kinsler's Grandslam after Samardzija walked the 1st three of the 4th inning rallied the Padred from a 3-1 deficit en route to a 6-3 win to pull within 2 games of 1st in the NL West.


St. Louis 12, Kansas City 0 (Reyes vs. Junis) – (sweep credit) Cards broke out of an ice cold start when Molina's 3-run HR and DeJong's grandslam keyed 5-run 1st and 2nd innings. The rotation struggles led to 11-19 start, but Reyes' shutout.

St. Louis 6, Kansas City 4 (Martinez vs. Kennedy) - With 4-4 tie, Ozuna walked to start 9th and Cards only speedster Robinson pinch ran, stole 2nd, went to third on wild pitch, and just beat throw home on grounder to short for winning run. Kennedy was the first PB2-4 to ever start a current game for me.

Diamondbacks vs. Nationals

Washington 9, Arizona 2 (Strasburg vs. Greinke) – (sweep credit) After outdueling Astros Verlander & Phillies Nola, Greinke's 2-1 lead disappeared in a 4th inning in which 2b Flores errored, and misplayed easy CD grounder 2-run, then left after rain delay

Washington 4, Arizona 3 (Corbin vs. Godley) - Nats clean-up hitter Rendon hit 2 homers, and Corbin made it into the 7th before getting help from the great pen.

5 in 10 innings (Ryu vs. Wood) - Reds Erwin pinch ran in 8th, stole and scored tying run, then threw out Pollock trying to score from 2nd to force extra innings. However, Muncy's 10th inn HR of Lorenzen gave LA 9th straight.


LA Dodgers 12, Cincinnati 7 (Buehler vs. Castillo) - Dodgers pounded out 9 runs in 1st and led 12-0 when Buehler tired after 5 LA Dodgers 6, Cincinnati scoreless innings. However, Reds pounded out 7 off what was left of Dodgers bullpen after extra inning affair.

Rockies vs. Marlins

Braves vs. Phillies

Mets vs. Cubs

Brewers vs. Pirates

All-Star Break - all teams at 36 game record (12 actual games played - shooting for 23

Friday, July 5, 2019

Yankees and Dodgers tie for 1st in Power Rankings Based on Projected Statis-Pro Cards

After calculating the rest of the updated Statis-Pro cards for the current season, I ran some quick math to who which team's cards look the strongest.

I took the 1-8 batters in the line-up I would use (to put NL and AL on equal footing, this leaves out pitchers batting but the AL also drops their weakest hitter). The Dodgers (0.817) nudge out the Astros (0.813) based on how their park neutral cards would produce over time (both teams are in pitchers' ballparks so this is higher than they would actually hit. We weight this line-up OPS times, compared to weighing the rotation ERA three times (Indians first if only Kluber were pitching), the relief core twice (where the Yankees 3.38 for their top six relievers is the best) and then I added up the On base running (OBR) and Speed (stealing ability) players AA, A or B marks to leave a speed ranking (where the Rockies are fastest).

In a power rating made for TV the Yankees and Dodgers come out tied for first place overall - with their weighted ranking just below 6th place. The big surprise is that the Nationals show up as the third best team with no real weaknessed, to really stand out as the only surprise in the top 8 which includes the two free agency sweep stakes winners (Bryce Harper led Phillies and Manny Machado led Padres) and the last three World Series winners (Cubs, Astros and Red Sox).

Rating fielding would have been tougher math, and these are cards based on what players were projected to do this year, so not super scientific but a rational basis to get a rough idea.

OverallPark Neutral CardsLine-up OPSrnkrotation erarnk6 relievers rnkOBR/SP RnkWt Ave
1Yankees0.78673.6873.381126.3
1Dodgers0.81713.7283.545256.3
3Nationals0.77893.4933.691347.5
4Red Sox0.78953.4623.7516228
5Astros0.81323.99153.701438.4
6Phillies0.79644.05163.67111610.2
6Cubs0.78663.90123.5992410.2
8Padres0.764143.88113.577610.9
9Mets0.763153.6453.62102011.5
10Rays0.752183.6763.5461411.6
11Indians0.740253.3713.598212.1
12Braves0.771113.7693.85201512.6
13Brewers0.768134.24203.474912.9
14Diamondbacks0.742243.5743.4322313.5
15Cardinals0.78384.10183.74152914.5
16Pirates0.759173.92133.69121714.8
17Rockies0.744213.77103.7717114.9
18Reds0.770123.97144.00251815.8
19Angels0.80434.27214.21282815.9
20Twins0.773104.16193.85212716.6
21Giants0.745204.28223.4432617.8
22Athletics0.761164.35243.78181919.1
23Rangers0.714284.05173.85191321.4
23Blue Jays0.745194.30233.92242121.4
25White Sox0.744225.05294.0126523.2
26Mariners0.743234.50274.09271023.7
27Royals0.707294.46263.9123724.7
28Tigers0.731264.61284.3230825.6
29Marlins0.726274.38253.88223025.7
30Orioles0.702305.28304.28291127.9

Thursday, July 4, 2019

NL Statis-Pro Standings After 10 Games; Click for Updated Player Cards with New Pitcher Ratings

The standings for all 15 NL Statis-Pro teams as of July 4 and all game results are here and listed below - as each team logged 10 actual games played for a 30 game record (we award a 3-game sweep for a 5-run win and 2 games to 1 series win for all other victories).

Click here for a newly updated list of all players for all 30 teams. Of the 98,816 visits to www.pudnersports.com, where we write about Statis-Pro baseball and www.valueaddbasketball.com, 9.161 clicked directly on instructions for how to play the game, with many others clicking on the actual playing cards and 46,268 coming straight to the site.

With so much interest, we just made an update to all the cards in line with one  big innovation you will notice on the pitching cards is that after using the traditional PB: 2-5, 2-6, 2-7, 2-8 or 2-9 for decades, we finally added the 2-4 and 4-7 ranges.

For those who are just learning the game, the pitchers PB rating is the central item of the game, as it determines if each roll from 2 through 12 on two 6-sided dice leaves the action on the pitchers card, with the other rolls (or Fast Action Card results) leaving the action on the more dangerous batter's card. Here is a Facebook page run by other people who play the game.

The top 5% of pitchers (I use ballpark adjusted FIPs but you can use ERA) get a rating of PB: 2-9 which means they control the action of 30 of 36 dice rolls - only allowing the batter's card to come in to play 17% of the time. If  a pitcher was not in the top 5% but was in the top 15% of pitchers he would get a PB: 2-8, if he was at least better than average in the top 45% then he was a PB: 2-7, and then the biggest group of pitchers were a PB: 2-6 with only the worst 15% as a PB: 2-5.

After that the original system deviates. The next best rating is a PB2-7, which used to go to the next 30% of pitchers, however

Later a range of PB: 4-7 was added which gives the pitcher exactly a 50% chance of keeping the action on his card, and a lower rating of PB: 2-4 was added which would give the pitchers with the worst FIPs or ERAs as small a chance of controlling the action (17%) and the batters had against a PB: 2-9.

In updating the google sheet of pitchers I took the top 500 pitchers (since that allows 16 or 17 per team to allow for even a few injuries and players coming up an down in addition to the 12 or 13 teams typically keep on a roster). There are an extra 248 pitchers projected in the system who could come up occasionally, but those "possible" major leaguers all receive the lowest PB: 2-4 rating.

The following breaks down the number of pitchers who get reach PB rating based on their projected ERA or FIPs. For example, there are 25 pitchers with a projected ERA of 3.28 or better, and those get a PB: 2-9.

ERA rangerange endstraditionalbell curveactual spotstop percentile
03.28pb2-9pb2-9255%
3.293.58pb2-8pb2-87515%
3.593.92pb2-7pb2-717535%
3.934.06pb2-7pb4-722545%
4.074.29pb2-6pb4-732565%
4.34.48pb2-6pb2-642585%
4.494.57pb2-5pb2-547595%
4.584.63pb2-5pb2-4500100%
4.646.16pb2-5pb2-4748

The next best 50 pitchers (up to the 75th best on the second line above) get PB: 2-8 etc. The second column of pb's above is the new system - however when a pitcher's new rating deviates from the traditional PB, we also list the traditional figure in the column before.

We will be using these ratings starting with the 11th game for each team. Here are the standings through the 10 games using the traditional PB ratings.


NL CentralWL
Cubs2010
Brewers1515
Reds1515
Pirates1416
Cardinals1119
NL EastWL
Braves1911
Nationals1614
Phillies1614
Mets1515
Marlins1020
NL WestWL
Diamondbacks1812
Dodgers1812
Giants1812
Padres1515
Rockies1119

Monday, July 1, 2019

Quick Statis-Pro Cards for any Missing or New Players You Want to Add to your Game

We consolidated various sets of instructions on Statis-Pro Baseball game into the following.


Basic Understanding of the Game 1

What you need to play 2

1. Dice or Fast Action Cards. 2

2. Player Cards 2

How to Play the Game 3

Setting Up 4

Order of Play 4

2-12 number: 4

11-88 number - 11 possible results (hits, balks, Ks, Walks, HBP, WP, PB, Out) 4

Left vs. Right Adjustment 12/88, 88/11 or other. 5

If Result is OUT: 5

Chance of Error on Hit or Out 6

Once you determine a player who might make an error - E-0 to E-10 6

SR and RR - How Long Can a Pitcher Pitch Before Getting Tired? 10

Taking Extra Bases on Hits, Hit and Runs, or Bunts 11

Optional Advanced Rules 13

Clutch Batting (BD): 14

Clutch Fielding (CD or for catcher CD-C): 14

Z-Play - unusual plays, injuries and tough fielding plays: 14


Statis-Pro Baseball was invented by Jim Barnes in 1970, and in an interview he invited others to adopt and update the game as “open source.” Our free version enables you to either play current teams with projected players, or to choose from 60 all-time great baseball teams. There is a complete game and many seasons of great advanced Statis-Pro cards on the Statis Pro Advanced Facebook page, if you want to try the game here first and consider ordering from them if you determine you like it.

Basic Understanding of the Game


The unique aspect of the game is that each plate appearance starts by determining if the pitcher is in control of the at-bat and his card will be used, or if he “makes a mistake” to put the action on the batter’s card and give him a chance for an extra base hit. An initial roll of two-tradition 6-sided dice or a use of “fast action cards” yield a number of 2-12. The best pitchers keep it on their card on 2-9, while the worst pitchers only control the action on a 2-4. Once you know whether the batter or pitcher card will be used for that at bat, a subsequent roll of two 8-sided dice for a result of 11-88 or a similar number from the fast action card gives the result of the plate appearance.

What you need to play

  1. Dice or Fast Action Cards. 

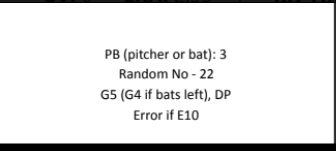
You need one of the three things in these photos. If you choose to use dice, you need two traditional 6-sided dice, two 8-sided dice of different colors, and one 20-sided die. If you prefer to use the free fast action cards we provide, they look like the all-white card below. Others sell much nicer fast action cards, so google “statis-pro baseball fast action cards” and you can find a set for $10 - you can see the blue and green corner of one of those cards and they really do add to the game..



  1. Player Cards 

Next, choose the teams you want to play. If you want to play two of the 60 all-time great teams, print the pitchers (see 1995 Braves below) from this pdf (one team to a page) and then follow these directions to print out the batters (see 1927 Yankees below) from a google sheet. If you prefer to play modern players, then choose the pages of the teams you want from all 2022 Projected Batters (49 pages, 9 cards to a page) and All 2022 Projected Pitchers (62 pages, 9 cards to a page) - the cards will have ranges like the Scherzer vs. Betts cards below. So you will be using EITHER team sheets of players or individual cards of players.


How to Play the Game

Setting Up


Choose a player on each team to pitch and play the other 8 positions - C, 1B, 2B, 3B, SS, LF, CF and RF. Next choose if you will use an extra batter as a designated hitter (DH) or have pitchers hit in the game. Once you choose the 9 who will start the game, write them down in the order they will hit from 1st through 9th.


If you are using cards you can shuffle them, but if you printed out our free ones, you may just want to put them all in a big bowl to pull out the cards one at a time. Of course, if you are using the five dice then no shuffling is needed.


If you are using player cards, you can stack the line-up in order. If using team sheets, you may want to use a couple of business cards to put below each batter as they hit.


Order of Play


2-12 number:

Get a result of 2-12 from flipping a card or rolling the dice. If that number falls within the pitcher’s PB rating (pitcher or batter) then the action will occur on the pitcher’s card, and if outside that range it will occur on the batter’s card. The possible PB ranges on pitchers’ cards, from best to worst, are 2-9, 2-8, 2-7, 4-7, 2-6, 2-5 or 2-4.


If you choose to use optional advanced rules, look at the bottom of these rules for CD, BD or Z-plays, which can occur in place of the 2-12 number.


11-88 number - 11 possible results (hits, balks, Ks, Walks, HBP, WP, PB, Out)

On the 2nd card, read the second number (Random Number 11-88) to see what happens on that card, or look at the 8-sided dice for the 11-88 number.. (If noone is one base, change any BK, WP or CD on line 2 to an OUT).


Here are the 10 possible results:


1B = Single 

2B = Double (only on batters' cards)

3B = Triple (only on batters' cards)

HR = Home Run (only on batters' cards)

BK = Balk if anyone on base (only on pitchers' cards, if no one on base treat as OUT)

K = Strikeout 

W = Walk 

CD-C = Catcher Clutch Defense - if not using advanced rules treat as out

HPB = Hit by Pitched Ball (only on pitchers' cards)

WP/PB = Wild Pitch or Passed Ball  (only on pitchers' cards, if no one on base treat as OUT)

Out = see below.


If using player cards, the card will also indicate the fielder who gets the ball on a single (1Bf, 1B7, 1B8 or 1B9) or double (2B7, 2B8, 2B9). If using a sheet, the reading is simply 1B or 2B so use the second digit of the number to determine the field. A 1 or 2 (11, 12, 21, 22 etc.) indicates the batter pulled the ball, so a RN or RP hits it to LF, a SN, SP or P to CF and a LN or LP to right. If the last digit is 3 or 4, the hit goes to LF, 5 or 6 goes to CF and 7 or 8 goes to RF.


On old fast action cards, you would check after a WP or BK for a “yes” or “no” result, but skip that step even if using those old cards. If anyone is on base, the WP or BK occurs if it comes up on the card.

Left vs. Right Adjustment 12/88, 88/11 or other. 

The Cht numbers at the bottom right of the batter card indicates numbers on which results are adjusted based on if the opposing pitcher is right-handed or left-handed. The standard 12/88 for a left-handed batter indicates that an 11 or 12 is changed from a hit to a strikeout against a left handed pitcher, and an 88 is changed from an out to a single with runners advancing two bases against a right-handed batter. The standard right-handed batter has an 88/11 meaning an 88 against a left-handed pitcher is a single, runners advance two bases while an 11 is changed to a strikeout against a right-handed pitcher. Typically a switch-hitter is –/– meaning no adjustment.


For some batters there are more numbers impacted, for example a 14/85 would be the most extreme possible adjustment, and mean the batter struck out on 11-14 against lefties, and had singles with runners advancing 2 bases on 85-88. Just remember the number to the left of the dash is the adjustment against lefties, and the number to the right of the dash is the adjustment against righties. Further, the number either goes all the way down to 11, or all the way up to 85 from what is listed.

If Result is OUT:

If the result is an OUT, the fast action cards we provide will tell you what type of out is made.


If using the nice Fast Action Cards you produce then the following will tell you what happens to runners on base.


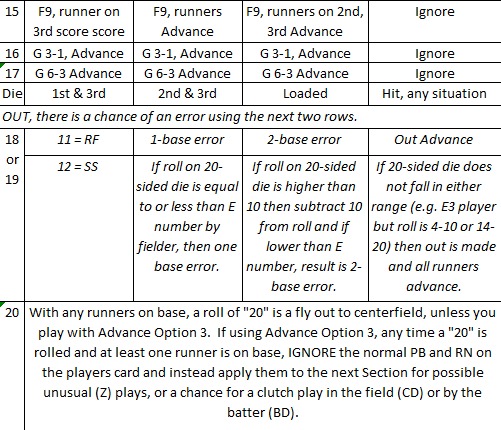
G6A (grounder to short) or any other A at the end of a grounder tells you the batter is out, but all runners advance.


Gx6 or any other reading with an x in the middle indicates runners hold and if there is a force out then the defense can throw out a forced runner. However, if runners are on 1st and 3rd then the defense must choose whether to take the out at second base and let the runner on third score or hold the runner at third and throw out the batter to leave runners on 2nd and 3rd.


G6 or any other reading with no x or A indicates a double play grounder if a runner is on 1st. However, if there is a runner on 3rd and no outs, the defense needs to either hold him and just throw the batter out at 1st, or let him score and turn the double play. If bases are loaded with no outs, the defense can choose to either throw the runner out at home, or take the double play from 2nd to 1st and let him score.


Chance of Error on Hit or Out

An error can occur under any of the three systems you can use for random numbers.


If using dice, any time a 18 or 19 on the 20-sided die is rolled there is a chance for an error. On a hit, the outfielder who fields the ball could make an error to allow an extra base on the hit, while on an Out the player could allow a 1- or 2-base error instead of an out.


On the nice Fast Action Cards you can buy from someone, a * will appear by the out result to let you know to check for errors on the next card. When using those cards, check for an error only on hits on the batter’s card - there is no chance of an error on a hit off the pitcher’s card.


If using the free fast action cards we provide, the Error Reading on the 4th card is only used if; there is a hit on the BATTER card on line 2 OR, there is a possible error (e?) on line 3 with an out. If the fielder's E number is in the range on this 4th line then everyone is safe in an out or gets an extra base on a hit. Flip for another 11-88 and if the number is 61-88 give batter and runners one additional base for a throwing error.


Once you determine a player who might make an error - E-0 to E-10

If there is a chance of an error on a player, then the next fast action card will determine if the error is in the player's range. A player can have anywhere from an E-0 (the best, never makes an error) to the worst E-10. If using the fast action cards, the next card will tell you if the error is in that range (e.g. Error 3-10 would be an error for an E-3 but not for an E-2).


If using dice, the 20-sided die determines the same thing with a roll of 3 meaning the same as a 3-10 range is an error. If the roll is 10 or higher, then subtract 10 but if it is an error then it is in the range. So a 13 die roll would be a 2-base error for an E-3, but no error at all for an E-2.


Obviously you cannot have a double play with noone on base, pardon the type under “1” with bases empty, just a grounder from shortstop to first base.


SR and RR - How Long Can a Pitcher Pitch Before Getting Tired?


The SR number is used for a starting pitcher, and RR used for a relief pitcher to see when they tire in a game.


For example, Greg Maddux on the sheet above would start at 15 or his SR.


This number is lowered by 1 every time the pitcher:


  1. Allows a runner to reach 1st base (unless on an error that is not his fault)

  2. Allows an earned run

  3. An inning ends while he is pitching (whether he started that inning, or cam in after it started)


Once a pitcher’s SR or RR is reduced to 0, his PB drops by 1, and then every additional education from one of those three occurs it is reduced by one more. If a pitcher started with the best rating of PB 2-9, then when he hit zero he would drop to PB 2-8, and then to 2-7, 4-7, 2-6, 2-5, 2-4, 2-3, 2-2 and if reduced further then the rest of the batters faced would skip the 2-12 number and automatically go to the 11-88 on the batter’s card.

Taking Extra Bases on Hits, Hit and Runs, or Bunts


Normally after getting the result you move onto the next batter. However, you can opt for any of the following strategies to advance base runners rather than going immediately to the next batter and the next 2-12 number.


Here are charts with various options. Note I have made some changes in writing after reviewing stats on frequencies of various scenarios. 


On bunts, we do have some all-time great players whose Sac (bunt) rating is AA+. The first time an AA+ player bunts in a game, use the AA column on the sacrifice chart BUT on an 11-28 he is safe at first base on a single. 


When a runner tries to take an extra base on a hit, the chart is used for the numbers on which he makes it to the next base. However, in some cases he cannot make it the extra base, but he is not thrown out either, he just sees a strong throw coming and stops at the base. He is only thrown if the 11-88 number for the throw is a 71-88 from a T-5 throwing arm for the outfielder, or a 75-88 for T-4, 81-88 for a T-3 and finally 85-88 for a T-2. Players advancing or being thrown out in modern baseball is even more rare, with layers taking the next base only 30 percent of the time and only being thrown out 1 percent of the time.


Optional Advanced Rules


You can choose to ignore a BD, CD or Z-play result to keep the game simple. If so, just ignore and play the 2-12 range to use the batter or pitcher card instead.


If you choose to play the advance rules, these can come up instead of the 2-12 number in the following ways.


If using dice, a roll of 20 on the 20-sided dice can overrule the 2-12 rating only if runners are on base.


If using fast action cards, in some cases a BD, CD or Z will come up instead of a 2-12 on some cards. With Fast Action Cards, Z-plays do happen even if noone is on base, but BD or CD is skipped if noone is on base.


Clutch Batting (BD):

If at least one runner is on base and the results is BD, or clutch batting, then the 11-88 number results in one of the following:


If the number would result in a 1B on the batters cards, then make the result is a 2B (double) and all runners on base score.


If the number would result in a 2B, 3B, HR or Deep on the batters card, then change to a home run.


If the number would have resulted in anything else on the batters card, then change to a foul ball, and the batter is still at the plate.


Clutch Fielding (CD or for catcher CD-C):

If the result is a CD-C then use the catcher's clutch defense rating from 1 to 5 but simply score as an Out if noone is on base. If a CD results and anyone is on base, then check to see which fielder has a chance to make a play. The fast action card will indicate which player, but if using dice then refer to the 2-12 number to determine the player.  If are using dice to determine which player has a chance for a clutch defensive player, or might commit and error - then use the following numbers:


2 or 3 = 1B, 4 = P, 5 = CF, 6 = 3B, 7 or 12 = SS, 8 = 2B, 9 - LF, 10 = C, 11 = RF.


Once you know the position, use that players CD rating of 1 to 5 then the 11-88 number on the chart below:


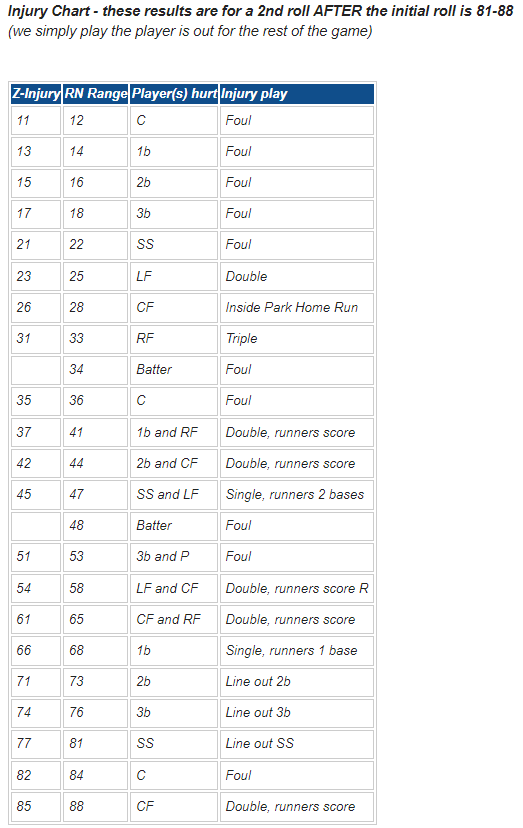
Z-Play - unusual plays, injuries and tough fielding plays: 

The following charts are used if an unusual “Z-Play” occurs. Draw a new 11-88 number.


Saturday, June 22, 2019

All MLB Rosters on One Easy Sheet to check you Statis-Pro Rosters as of All-Star Break

You can find all current and likely 2019 Major League players and their Statis-Pro projected cards used to play Statis-Pro updated as of the All-Star break. Our Power Ratings indicate the Yankees and Dodgers are the strongest two teams in the game, so to play them against each other just click on the two images below. You could start a game with Aaron Judge (top line, Yankees, black type indicates position players) batting against Clayton Kershaw on the Dodgers team below (starting pitchers in blue, relievers in red).

A roll of two six sided dice refers to the "Control" figure by Kershaw, a 2-8 meaning he keeps it on his card on those numbers, so a 9-12 roll puts in on Judge's card. You then need two 8-sided dice for an 11-88 roll to see what happens on that card. For Judge up to 13 (see 1b column below) is a single, up to 17 a double, 18 a triple, up to 27 a home run, up to 54 a strikeout, yo 71 for a walk, 72 is a hit by pitch and up to 88 an out.

You can literally play a Dodgers-Yankees game with those dice and the teams below, but you can also look at these instructions to add fielding, speed and any other aspects of the game. We track our ongoing NL season here, where the Dodgers have the best record at 23-13. My friend is playing the AL this year and said his biggest problem is figuring out how to fit stars into the line-up.


This does not play NEARLY as fun as using a set of cards from last season, but I keep the projection page up for when you are looking for a player who is missing, or suddenly have a player in a new stadium (e.g. Coors). The projections were all park neutral before the season started. (July 3 we updated all rosters with projections for any missing players, so the rosters are complete with suggested lineups and pitching rotations).

Comparing all 30 rosters took some time, so for the hundreds of new players I did not actually produce new cards yet. Rather I set up a very basic card that could be used for a batter with an OPS closest to .800, .750, .700, .650, .600 and then just listed steals to give you an idea of whether you should give him a triple in place of his highest double, and take a stab at OBR/SP. Basically sorted each team's actual roster plus DLs by OPS and then by ERA. The yellow means I do not have a card for them but wanted to at least show were they might fit in the line-up.

I am sure I will produce a batch of cards for new players just to fill in gaps, but after putting hours into getting all rosters on one sheet and clearing out the junk, I wanted to get this down and resume playing.

Here is the blog tracking the standings in my game - the Braves are leading the NL East and Cubs the NL Central.

Thursday, June 20, 2019

Box Score from UVA 2019 Beating Chris Paul's Wake Forest Team on NBA Draft Night

I had just moved from my Value Add Basketball Game to Statis-Pro Baseball after the NBA Finals, but I decided to put Chris Paul's Wake Forest team up against UVa's recent national champs. UVa was the first team with three players in the top 20 at www.valueaddbasketball.com, and all three were picked in the NBA Draft including De'Andre Hunter as the 4th pick (he will make $14.5 million for his first two years while teammate Ty Jerome will make $4.5 million for being picked 24th ,while Kyle Guy UVa is not guaranteed a contract but was picked in the second round). In my game, UVa moved into 2nd place in the vicious 8-team ACC with the blowout of Wake Forest.


(Those who want to play the game should read the note at the bottom on the numbers to the left showing when each player plays.) Because average point differential is my tie-breaker, a team winning big does leave the starters in until the end - and in this case Kyle Guy hit a 3-pointer at the end and then Jerome stole the ball to end the game and give UVa an average win margin of +15 to nudge past Duke (+14) and UNC (+12) for second place behind Carmelo Anthony and the 3-0 Syracuse team. Since I also play possessions rather than actual time, so UVa's slowest in the nation pace is not a factor as they get a half dozen more possessions than they typically get in a game. They were the only team I've had in almost 60 games played to only allow 1 steal and they actually only had two turnovers in the game.

The other ACC game I played back-to-back to get all 8 teams up to three games was much more exciting. Georgia Tech (2004) Jarrett Jack grabbed six steals and drove to the hoop to foul Pitt (2019) point guard Lawrence Fields which was a key down the stretch. The game stayed within 2 points from 39-38 with 20 possessions left (12:08) to 55-53 (1:52 left) when Pitt's DuJuan Blair seemed to give Pitt to chance by rejecting a shot, only to have Georgia Tech's Luke Schenscher grab the rebound and score to make it 57-53 en route to a 57-54 win that left both teams at 1-2.


I do let four ACC teams make the tournament since there are five National Champions and in the conference, and the next closest is the Big East with three (even though I did move Syracuse from their actual 2003 spot in the Big East to the ACC as I was balancing the conferences.


Note for those playing the game. The game starts with a 20-20 score and 44 possessions remaining, which we count down from 44-1 on the scoresheet. I do show the box scores for all games in all 8 conferences in this google sheet, That sheet let's other players look at the numbers on the left side of the box to see what possessions I have each player in the game and at what position. Jerome is one of the more complicated rotation guys since Hunter and him can basically play anywhere from point guard to power forward. The numbers show that he starts the game at the "1" or point guard and the first range of 44-34 means those are the 11 possessions he plays at that position. he then gives Hunter a two possession rest during possessions 32-31 at the "4," then he sits out one possession (the 30th), and finally ends up at the "2" for the final 30 possession of the game (30-1). Braxton Key plays at the "2" from 44-31 until Jerome gets there.